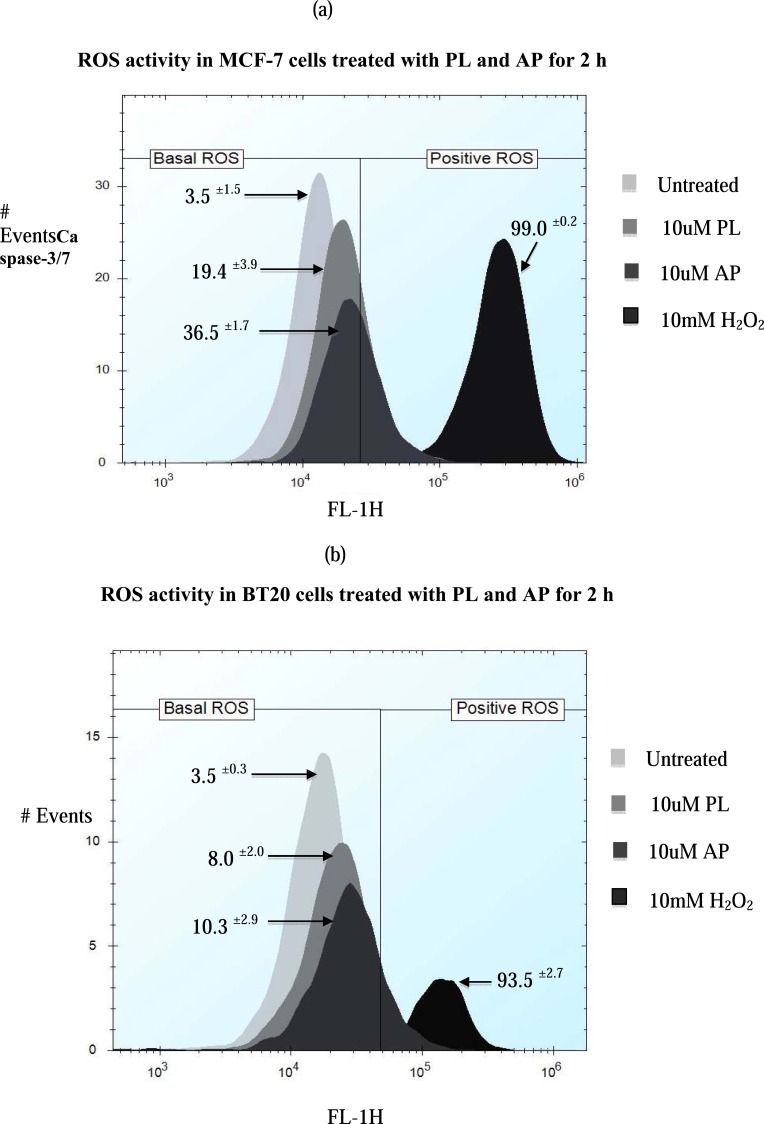
Fig. (5).
Effect of 10 and 20 µM PL and derivatives on ROS production in MCF-7 and BT20 cells. ROS activity in cells was determined by staining with the DCFDA dye and cells were using flow cytometry. The percentages of stained cells are shown on the histograms. Data are mean ± standard deviation S.D. (n=3). Cells were treated with 10mM H2O2 for 1 h as a positive control to show that assay was working.

