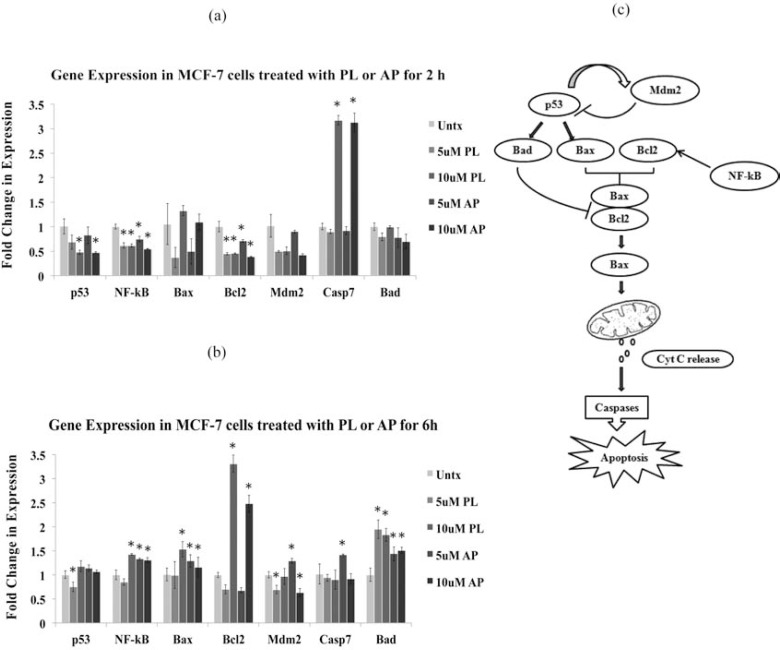
Fig. (6).
Molecular profiling by measuring mRNA levels of key apoptosis-associated genes using RT-PCR. The MCF-7 cells were treated with 5 and 10 µM of PL and AP for 2 and 6 h in duplicate experiments. Bar graph representing the expression profiles of p53, NF-Kb, Bax, Bcl2, Mdm2, Casp7, and Bad genes after treating the MCF-7 cells for (a) 2 h, and (b) 6 h. Data are mean±S.D. (n=3), *p<0.05 significant difference to untreated (Untx) control. (c) Pathway diagram showing the interplay of the tested genes during the apoptotic cell death.

