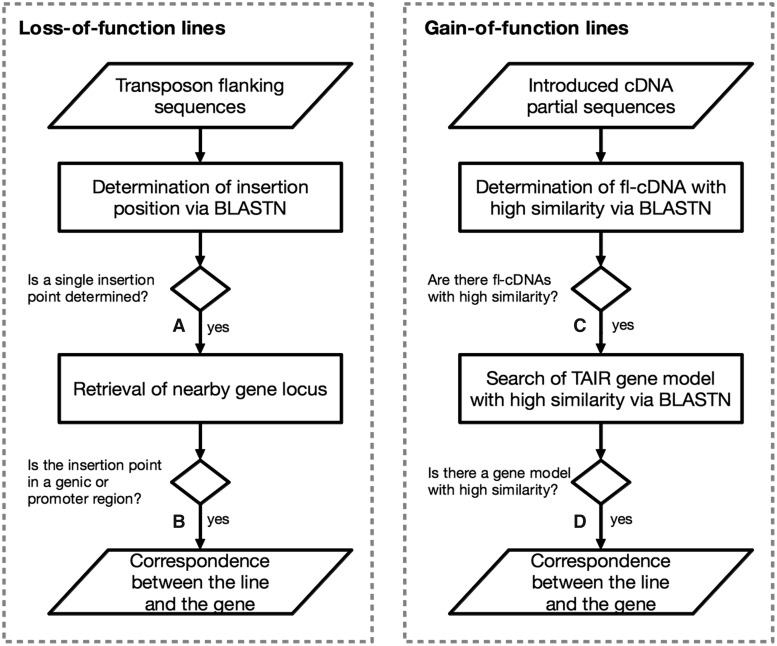
Fig. 1.
Annotation workflow of loss- and gain-of-function lines. To deduce disrupted and induced genes, we employed independent methods for loss- and gain-of-function lines. For loss-of-function lines (A), we determined a single transposon insertion point and then (B) deduced the genes in which the transposon was inserted into the gene or promoter region. For gain-of-function lines (C), we deduced the introduced full-length cDNAs and then (D) searched for highly similar gene models. Detailed values at each step are described in Tables 1 and 2.

