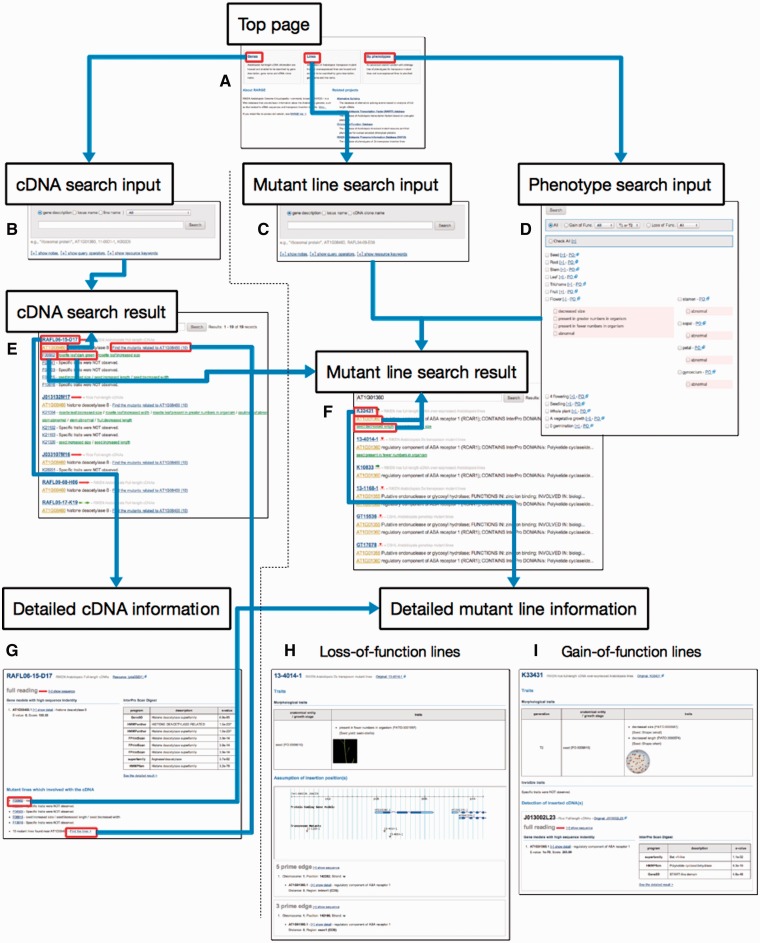
Fig. 2.
Operation workflow of the web-based database. (A) On the top page, users can select the desired resource, fl-cDNAs or mutant lines, or can find mutant lines by phenotype using the ontology tree. Then they can (B) search fl-cDNAs by keywords with filtering from the fl-cDNA search input page, (C) search for mutant lines by keywords with filtering from the mutant line search input page and/or (D) search all mutant lines by selecting phenotype items in the alternative mutant line search input page by phenotype tree. (E) The fl-cDNA search result page shows records that include the fl-cDNA clone name, gene locus name, gene description, the number of mutant lines with disruption or induction of the gene and the mutant lines into which the fl-cDNA was introduced. (F) The mutant line search result page shows records that include the line name, resource name, deduced disrupted or induced gene locus name, gene description and phenotypes observed. (G) The detailed fl-cDNA information page shows the fl-cDNA sequence, its InterPro Scan result, gene models with high degrees of similarity and the names of mutant lines into which the cDNA was introduced. (H) The detailed mutant line information page for the loss-of-function lines shows the visible phenotypes, including the original phenotype description, mapped PO information and PATO information, line photographs and deduced transposon insertion point. (I) The detailed mutant line information page for the gain-of-function lines shows the visible and invisible phenotypes including the original phenotype description, mapped PO information and PATO information, line photographs, the fl-cDNA sequence, its InterPro Scan result and gene models with high degrees of similarity.

