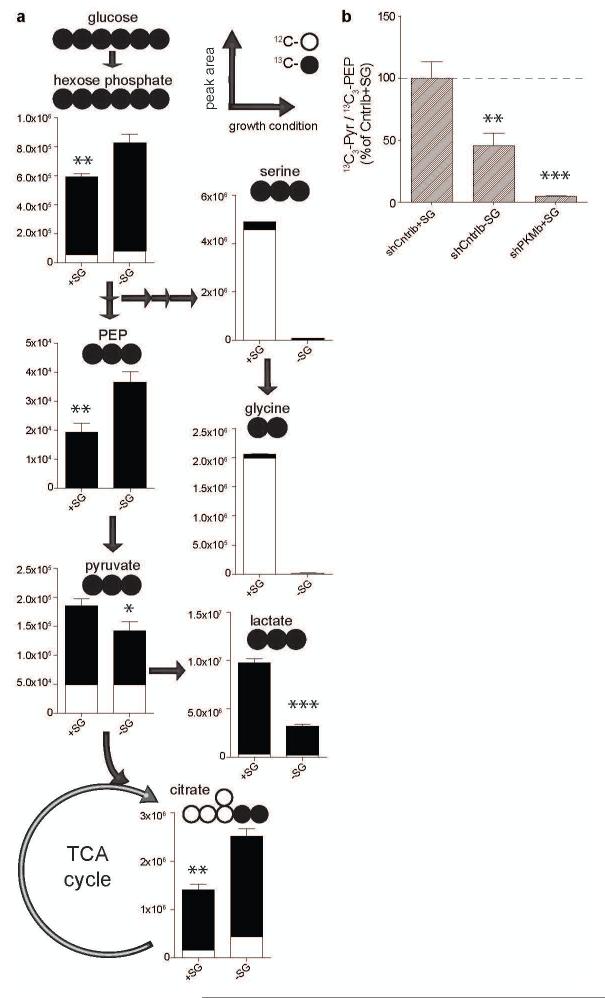
Figure 3. Serine and glycine deprivation changes glucose metabolism.
a, Parental HCT116 cells were incubated for 12 hours with U-13C-glucose in the presence (+SG) or absence (−SG) of serine and glycine. The abundance of the main glucose-derived isotopomer (black bars) and the unlabelled fraction (white bars) of the indicated metabolites were analysed. The circles represent the isotopomer distribution of each individual metabolite. b, PK activity is represented as the ratio between glucose-derived (13C3-) pyruvate and PEP, 30 minutes after labelling with U-13C-glucose in the presence or absence of serine and glycine in the indicated cell lines. Results were normalised to shCntrl +SG. PEP, phosphoenolpyruvate. All results are from 3 independent cultures and they are presented as mean ± s.e.m. * = P< 0.05, ** = P<0.01, *** = P< 0.001.

