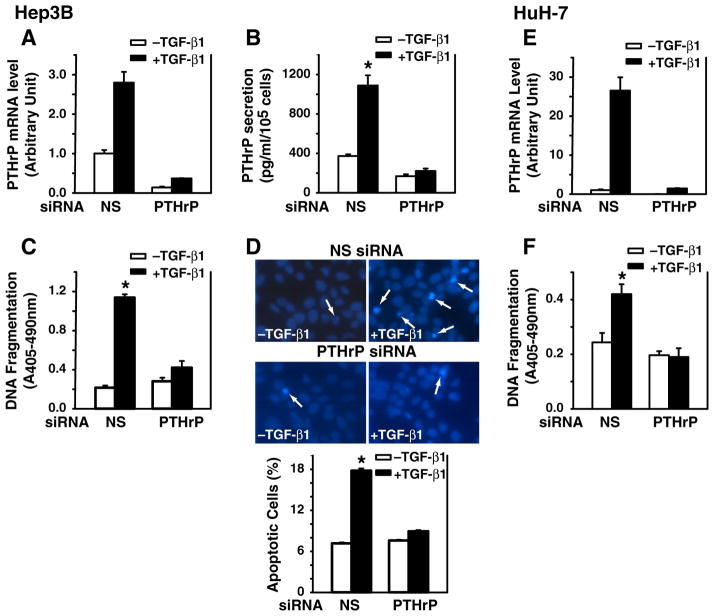
Fig. 2.
Silencing PTHrP gene expression blocks TGF-β-induced apoptosis. Hep3B and HuH-7 cells were transfected with human PTHrP siRNA (100 nmol/L) using DharmaFECT2 and then replated 24 h after siRNA transfection. The cells were then cultured in the presence or absence of TGF-β1 (40 pmol/L) in MEM supplemented with 0.1% FBS for 48 h. Panels of Hep3B cells: A. Total RNA was prepared and converted to cDNA for real-time quantitative PCR analysis of PTHrP mRNA expression. B. The cell culture supernatants were collected and concentrated for measurement of PTHrP peptide secretion. The concentration of PTHrP from triplicate wells is expressed as pg/ml and normalized by cell number. Results from triplicate wells are expressed as mean ± SEM. C. DNA fragmentation was quantified by cell death detection assay. Results from triplicate wells are expressed as mean ± SEM. D. Nuclear morphology of Hep3B cells was examined using Hoechst 33258 staining. Arrows indicate apoptotic cells. Apoptotic cells are expressed as percentage of apoptotic cells versus total cells. Panels of HuH-7 cells: E. Total RNA was prepared and converted to cDNA for real-time quantitative PCR analysis of PTHrP mRNA expression. F. DNA fragmentation was quantified by cell death detection assay. Results from triplicate wells are expressed as mean ± SEM. *p < 0.05 compared to the group in the absence of TGF-β1.

