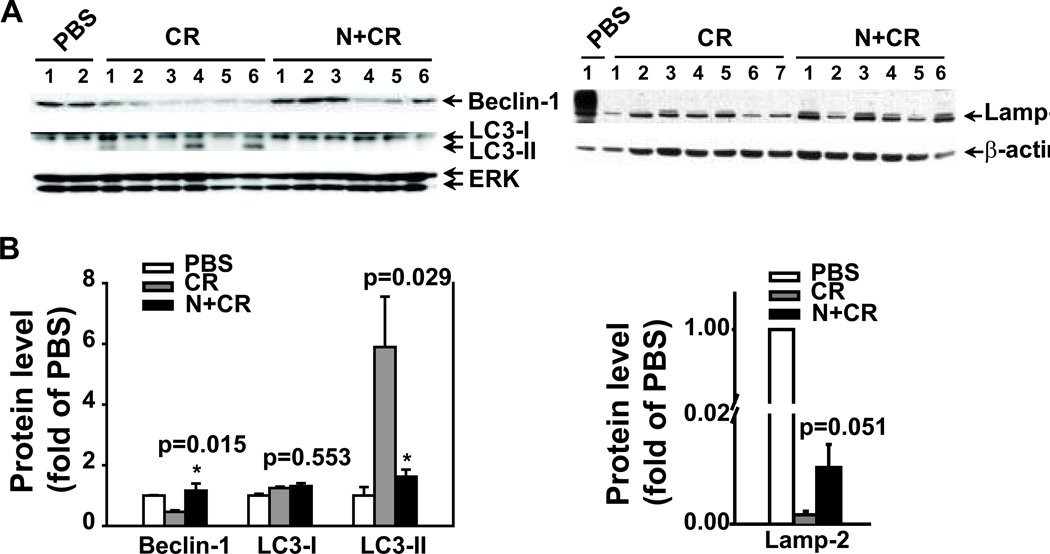
Figure 7. Noggin modulates levels of autophagy proteins in CR-induced AP.
Pancreatic tissue samples were obtained from the groups described in Figure 3. The pancreas from the mice treated with PBS alone was included as a baseline control. Protein lysates were prepared for Western blotting analysis using specific antibodies against Beclin-1, LC3 or Lamp-2. ERK or β-actin served as a protein loading control. A. Western blotting images. B. Quantification of the corresponding Western blots. The protein levels were normalized against ERK or β-actin and quantified. The data are expressed as relative fold changes to PBS group. n=6–7 mice in CR or N+CR group. * p<0.05 compared N+CR to CR.

