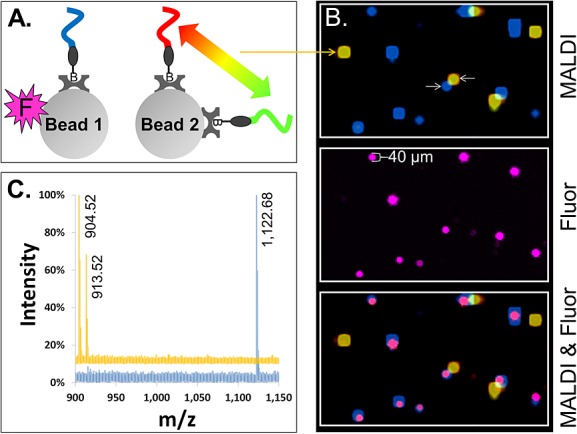
Figure 3.

MALDI-MSI imaging of single beads carrying photocleavable peptide Mass-Tags. (A) Two species of 30 µm streptavidin glass beads were prepared, pooled and used to form a two-dimensionally ordered, random bead-array. ‘Bead 1’ carried a single photocleavable biotin peptide Mass-Tag (blue) and a fluorophore (magenta ‘F’). ‘Bead 2’ carried two different photocleavable biotin peptide Mass-Tags (red and green) but no fluorophore. (B) (‘MALDI’) Color-coded MALDI-MSI image of a 1360 by 800 µm2 region of the bead-array. Co-localization of the red and green Mass-Tags on Bead 2 appears as yellow. (‘Fluor’) Fluorescence image of same region of the bead-array, showing Bead 1. (‘MALDI & Fluor’) Synchronized MALDI-MSI and fluorescence images showing co-localization of the fluorescence marker on Bead 1 (magenta) with the expected Mass-Tag (blue). (C) Color-coded MALDI spectra are shown from the center pixel of representative beads (the beads indicated by white arrows in (B)). The blue spectrum is from Bead 1 and yellow from Bead 2. Observed monoisotopic masses of the Mass-Tags are labeled in the spectra (note that while the scaling of the spectra does not allow visual discrimination of the natural isotopes of each Mass-Tag, separated by 1 m/z, they are resolved; for example, see Fig. 4(B) ‘x-Axis Expansion’ inset).
