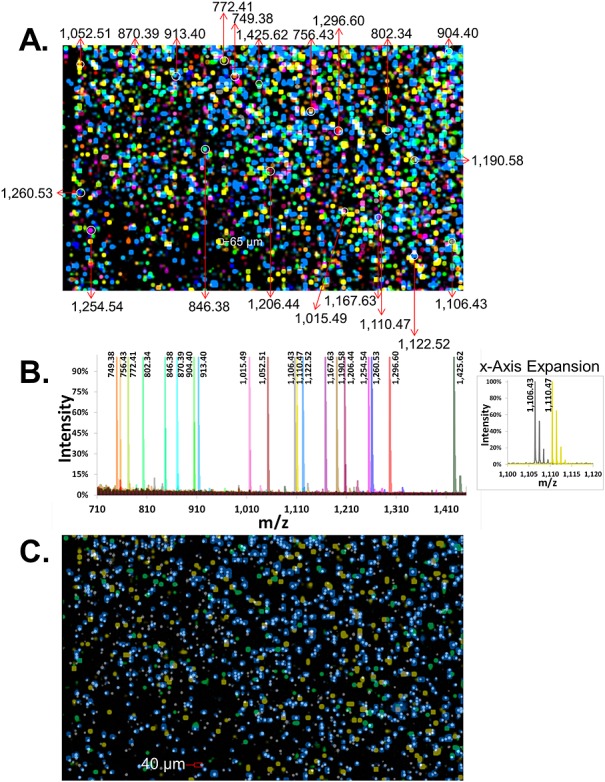
Figure 4.

Synchronized MALDI-MSI and fluorescence imaging of 20-member Mass-Tag bead-array. (A) Color-coded MALDI-MSI image of a 5920 × 3640 µm2 region of a 20-member photocleavable Mass-Tag bead-array (photocleavable biotin peptide Mass-Tags loaded onto streptavidin glass beads). Corresponding masses (m/z) for Mass-Tags from representative beads (white circles) are indicated. (B) Color-coded overlaid MALDI-MSI spectra are shown for representative beads in the array (the beads indicated by white circles in (A)). Observed monoisotopic masses are listed. The ‘x-Axis Expansion’ inset shows a zoomed view of two distinct Mass-Tags of similar size, indicating a high mass resolution which can discriminate Mass-Tags separated by approximately 4 m/z units as well as the natural isotopes for each, spaced by 1 m/z unit. (C) One Mass-Tagged bead species in the array was labeled with fluorophore (e.g. as in Fig. 3(A)). The fluorescence image of this bead species (same region as in panel (A)) is shown (gray/white spots) synchronized with a MALDI-MSI image of its cognate Mass-Tag (blue). For simplicity, MALDI-MSI images for two other Mass-Tags on non-fluorescent bead species are also superimposed (yellow and green).
