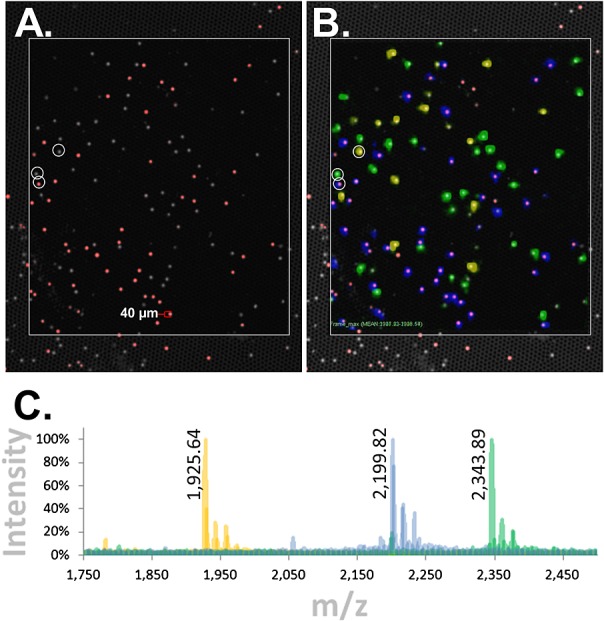
Figure 6.

Bead-GPS array with cysteine peptides directly attached to TentaGel® beads: synchronized MALDI-MSI and fluorescence imaging. A model 3-member bead-array was created with cysteine peptide Mass-Tags attached to TentaGel® beads using the novel NHS-PC-tBOC Linker. Similar to Fig. 3(A), one of the bead species was additionally tagged with fluorescence. The bead-array was imaged by MALDI-MSI and fluorescence. (A) Fluorescence image of bead-array. Gray/white is auto-fluorescence of all TentaGel® beads when excited with the 488 nm laser of the microarray scanner (fluorescein channel; the micro-wells are also weakly visible), while red is the fluorescently tagged bead species. (B) Synchronization of fluorescence and MALDI-MSI images. The three Mass-Tags are color-coded blue, green and yellow. The blue Mass-Tag aligns with the red fluorescent beads. (C) Color-coded overlaid MALDI-MSI spectra from the center of representative beads (the beads indicated by white circles in (A) and (B)). Monoisotopic masses for the –16 m/z (oxygen loss) species of the Mass-Tags are listed as these are the dominant species in the bead-arrays. Observed monoisotopic masses are 1925.64, 2199.82 and 2343.89 m/z while expected are 1925.29, 2199.36 and 2343.39 m/z, respectively (note that due to the scaling of the spectra, monoisotopic peaks are not discernible but are resolved; for example, see Fig. 4(B) ‘x-Axis Expansion’ inset or inset in Supplementary Fig. S1 (Supporting Information)).
