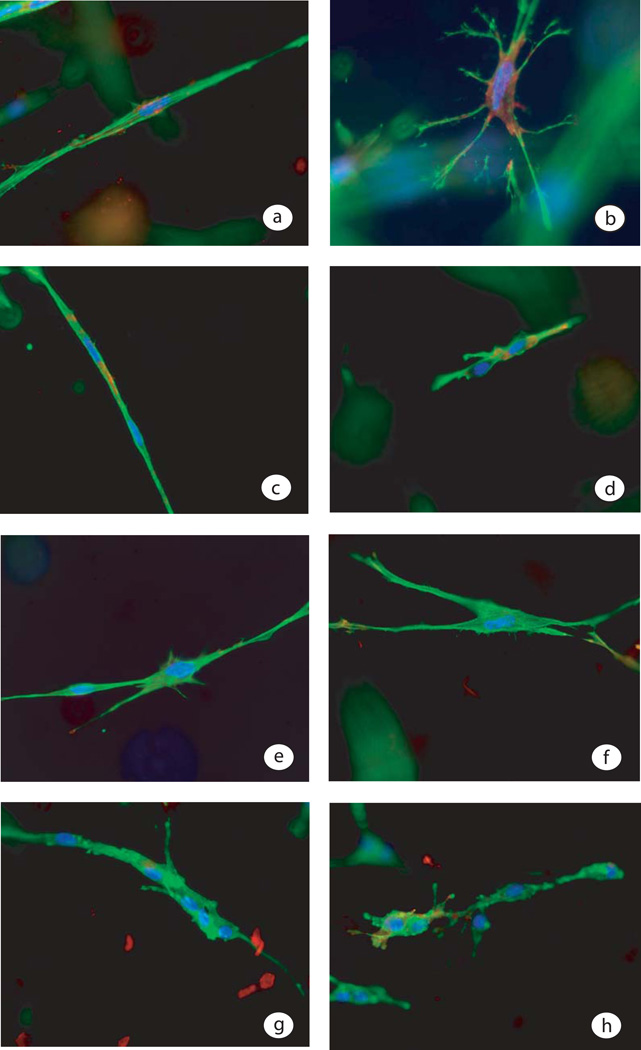
Figure 3.
Fluorescent staining of cells in PCL is presented, where α-SMA is stained red, phalloidin-stained microfilaments stained green and the nuclei stained blue. Panel a) is a myofibroblast in an attached PCL on day 4 just before release. Panel b) shows a contracted myofibroblasts 10 minutes after release of an attached 4 day myofibroblast PCL. Panel c) shows two attached fibroblast PCL 1 day after casting and panel d) shows two fibroblasts within a 1 day old fibroblast PCL 10 minutes after release. Panel 3e shows two cells in a 4 day old fibroblast PCL treated with vanadate for 24 hrs and panel 3f shows a fibroblast 10 minutes after release in a vanadate treated PCL. Panel 3g shows a vascular SMC in a PCL for 4 days and panel 3h shows vascular SMCs 10 min after release of an attached SMC-PCL.

