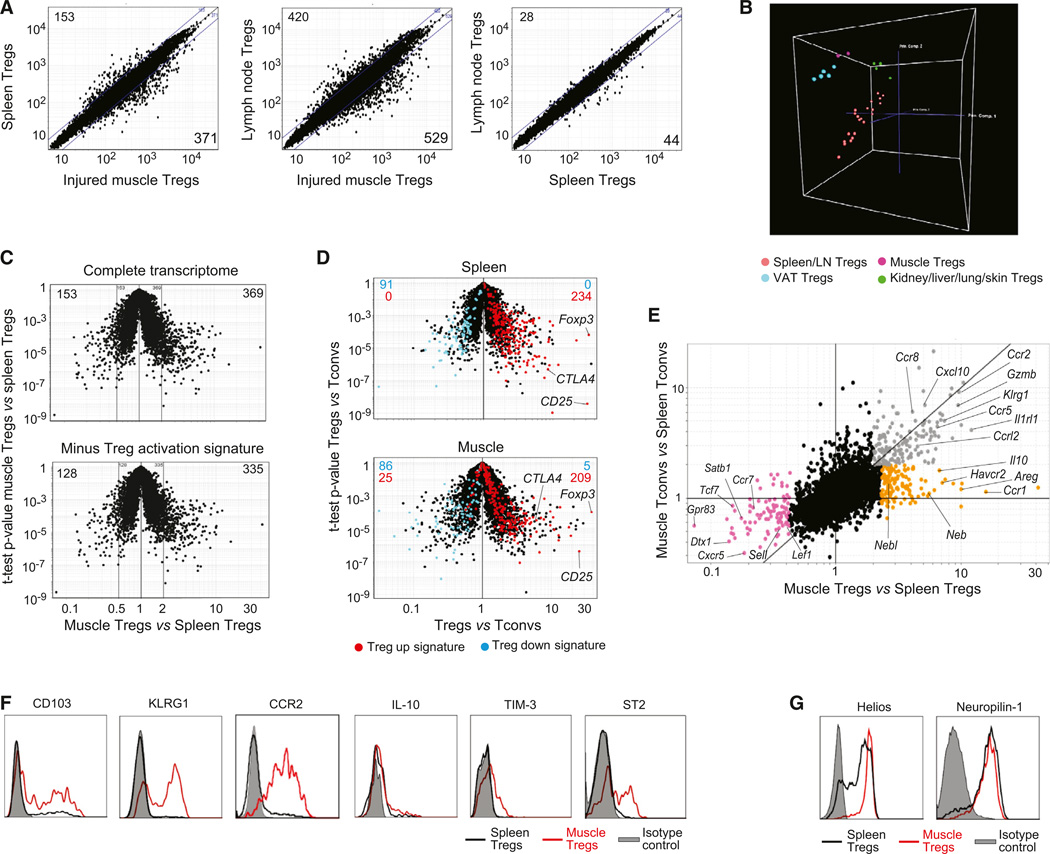
Figure 2. A Unique Population.
(A–E) Gene-expression analyses on cells 14 days after Ctx injury. (A) Comparison plots of normalized expression values. Numbers indicate the number of genes whose expression differed by more than 2-fold. (B) PCA analysis comparing muscle Tregs 4 or 14 days after Ctx injury with other Treg populations. Each dot represents the meanofthree independentexperiments. (C) Top: volcano plot comparing gene expression ofmuscle versus spleen Tregs. Bottom: same plot after subtraction of the Treg activation signature (Hill et al., 2007). Numbers represent the number of differentially expressed genes (>2-fold). (D) Volcano plots comparing gene expression of Treg versus Tconv cells. Treg signature genes (Hill et al., 2007) are highlighted in red (induced) or blue (repressed). Numbers represent the number of genes from each signature expressed by each population. (E) Fold-change differences in gene expression between Treg and Tconv cells from muscle and spleen. Differentially expressed genes are highlighted in orange, gray, or pink.
(F and G) Cytofluorometric analyses of surface and intracellular markers. Histograms depict expression by Foxp3+ T cells from muscle (red) or spleen (black).
Gray: isotype control.

