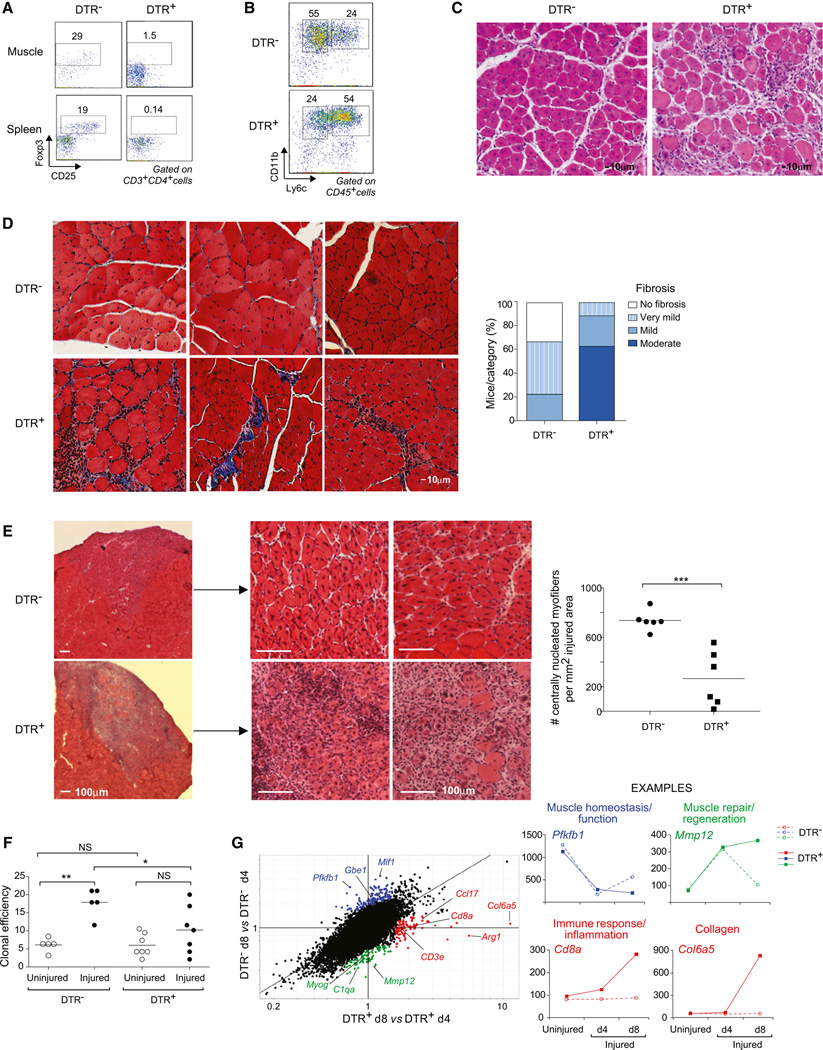
Figure 4. Treg Ablation Impairs Muscle Regeneration after Wounding.
Eight-week-old Foxp3−DTR+ or DTRT− littermates were injured with Ctx and treated with DT to induce Treg depletion.
(A and B) Flow cytometry of Treg and myeloid-lineage population, 7 days postinjury. Numbers in (A) refer to % CD4+ T cells that are Foxp3+, and numbers in (B) refer to % Ly6c−/lo or Ly6chi of CD11b+ cells.
(C) Hematoxylin and eosin (H&E) staining of muscle sections 7 days after Ctx injury. Representative of at least three experiments. Original magnification ×100.
(D) Left: fibrosis detection by Gomori trichrome staining of muscle sections 13 days after injury. Collagen stained in blue. Representative examples of seven DTR+ and seven DTR− mice. Original magnification ×200. Right: summary quantification.
(E) Left: H&E staining of muscle sections 7 days after cryoinjury. Original magnification ×25 (left) and ×100 (middle and right). Representative examples of six samples. Right: quantification of regenerative fibers per mm2 of injured area. ***p < 0.001.
(F) Clonal myogenesis assays of satellite cells from uninjured or day 4 Ctx-injured muscles. Percent of wells seeded that showed a myogenic colony at day 5. Summary of six clonal assays *p < 0.05; **p < 0.01.
(G) Left: FC/FC plot of gene expression values in muscle 4 versus 8 days after Ctx-induced injury in mice without (DTR+) or with (DTR−) Tregs. Highlighted in different colors are sets of genes described in the text. Right, representative examples of genes in each highlighted set.

