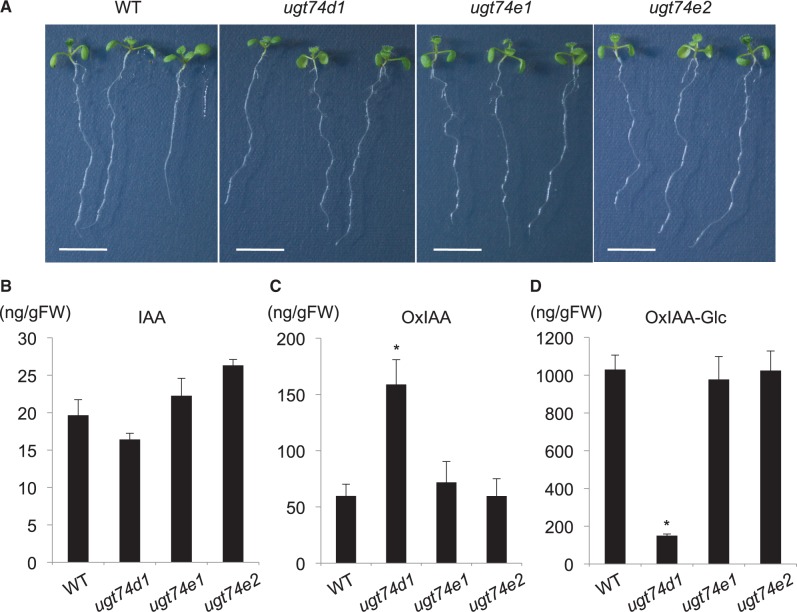
Fig. 3.
Analysis of the OxIAA pathway in ugt74d1. (A) Phenotypes of the wild-type (WT), ugt74d1, ugt74e1 and ugt74e2. Bars indicate 5 mm. (B and C) Endogenous concentration of IAA, OxIAA and OxIAA-Glc in the WT, ugt74d1, ugt74e1 and ugt74e2. Values are mean ± SD (n = 3). *Differences between the WT and mutant are statistically significant at P < 0.05 (Student’s t-test).

