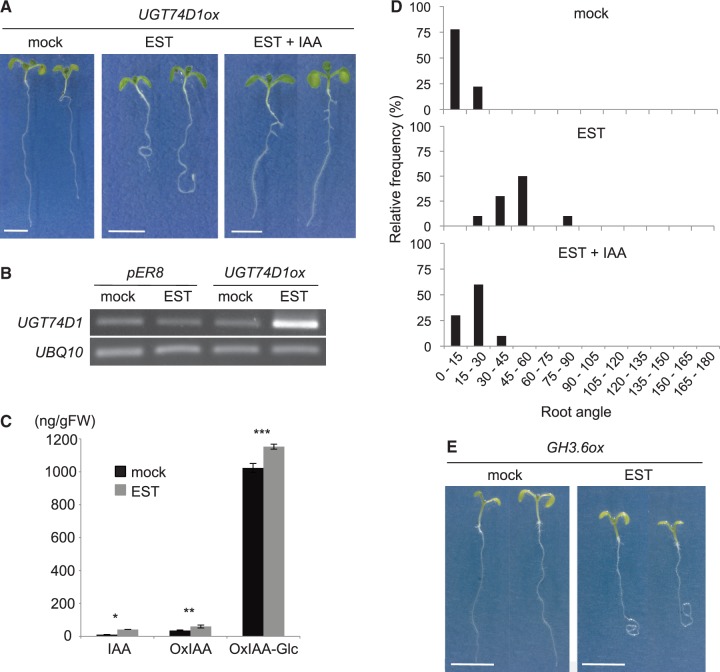
Fig. 4.
Analysis of the OxIAA pathway in UGT74D1ox. (A) Phenotypes of UGT74D1ox without EST (mock), with 10 µM EST (EST) and with 10 µM EST and 20 nM IAA (EST + IAA). Bars indicate 5 mm. (B) Semi-quantitative RT–PCR analysis of UGT74D1 expression in the vector control (pER8) and UGT74D1ox without EST (mock) or with 10 µM EST. (C) IAA, OxIAA and OxIAA-Glc concentrations in UGT74D1ox without (mock) or with 10 µM EST. Values are mean ± SD (n = 3). *, ***Differences between UGT74D1ox with and without EST are statistically significant at P < 0.01 (Student’s t-test). **Differences between UGT74D1ox with and without EST are statistically significant at P < 0.05 (Student’s t-test). (D) Histogram displaying the range of the root angles from the gravity vector for UGT74D1ox plants without EST (mock), with 10 µM EST and with 10 µM EST and 20 nM IAA (EST + IAA) are shown (n = 9–10). (E) Phenotypes of GH3.6ox without EST (mock) or with 10 µM EST. Bars indicate 5 mm.

