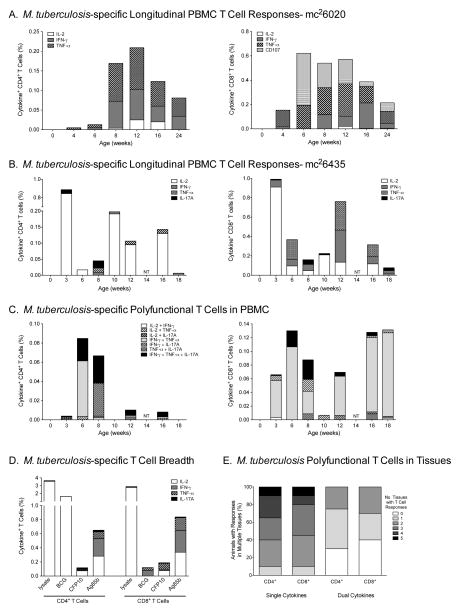
Figure 1. Mtb-specific T cell responses in PBMC.
Panel A and Panel B: CD4+ and CD8+ T cytokine responses after in vitro BCG or PPD stimulation of longitudinally collected blood samples from a representative animal vaccinated with strain mc26020 (Panel B) or with strain mc26435 (Panel C), respectively. Note, only single-functional responses are shown. Panel C: Polyfunctional T cell responses in a representative animal in longitudinally collected blood samples. Panel D: T cell responses are induced against a number of Mtb-specific antigens (PBMC data from a representative animal). Panel E: The percentage of animals with vaccine-induced single and polyfunctional PPD-specific T cell responses in tissues. T cells were isolated from selected tissues (tonsil, submandibular LN, ileum, colon and axillary LN) from all animals in Group B. Using a gray scale gradient, the percentage of vaccinated animals that have PPD-specific cytokine producing T cells in all 5 tissues (indicated as ‘5’) is indicated in black, whereas animals lacking PPD-specific responses in all 5 tissues (indicated as ‘0’) are shown in white. Data are stratified by CD4+ and CD8* T cells. CFP, Mtb culture filtrate protein; lysate, Mtb whole cell lysate; BCG, bacille Calmette-Guérin vaccine strain; Ag85b, antigen 85b.

