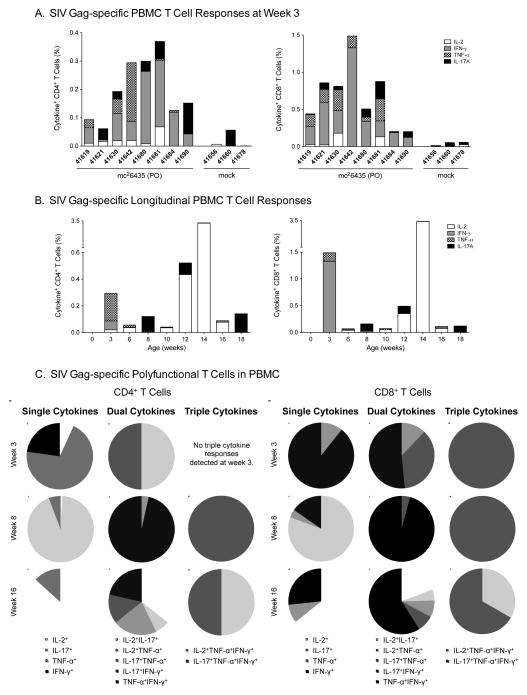
Figure 2. SIV-specific peripheral blood T cell responses.
Panel A: Cytokine production following SIV Gag stimulation in peripheral T cells at week 3 for all mc26435-primed animals in Group B. Panel B: CD4+ (left panel) and CD8+ (right panel) T cell cytokine production in response to in vitro SIV Gag stimulation in longitudinally collected blood samples of a representative animal after vaccination. Panel C: SIV-specific single, dual and triple positive cytokine responses in peripheral blood CD4+ (left panel) and CD8+ (right panel) T cells at weeks 3 (post-prime, pre-boost), 8 (post-boosts) and 16. Distinct cytokines or combinations thereof are indicated by different colors in the graph legend.

