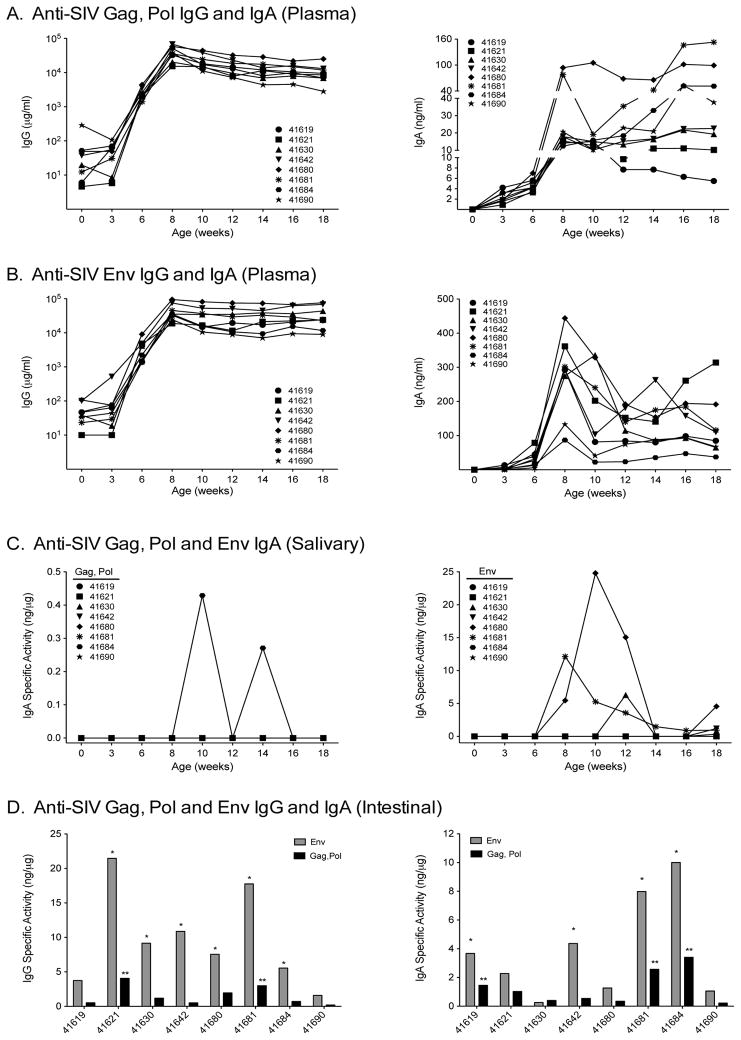
Figure 4. SIV-specific plasma and mucosal IgG and IgA antibodies.
Panel A and Panel B: Anti-SIV Gag, Pol or anti-SIV Env IgG (left graphs) and IgA (right graphs) antibody development in plasma following oral priming with strain mc26435 plus MVA-SIV boosts. Note that IgG values are represented on a log scale and IgA values are plotted linearly. Panel C: SIV Gag, Pol (left panel) and Env (right panel) specific activity for IgA in saliva following priming with strain mc26435 plus MVA-SIV boosts. Panel D: The specific activity for intestinally-secreted anti-SIV Gag, Pol (black) and anti-SIV Env (gray) IgA (left) and IgG (right) antibodies following priming with strain mc26435 plus MVA-SIV boosts. Intestinal antibodies were only measured at the time of euthanasia. One (*) or two stars (**) above bars indicate that antibody measurements for anti-SIV Env or anti-SIV Gag, Pol, respectively, exceeded mean background levels ± 3SD.

