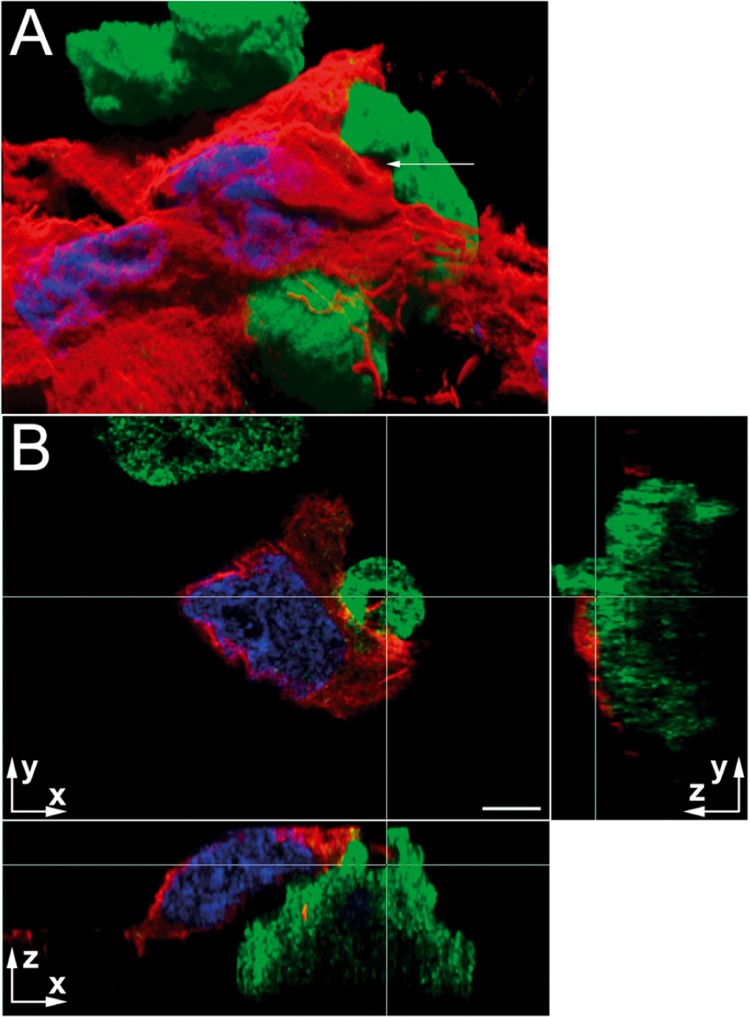
Fig. 2.
Immunolocalization of amoebic protein KERP1 during interaction of virulent trophozoites with LSEC. Confocal microscopy acquisitions showing immunolocalization of KERP1 (green) delimiting the parasite and detection of F-actin (red) the LSEC. Nuclei are stained by DAPI (blue). Scale bars (on axis labels), 5 µm. A. Virtual three-dimensional reconstruction of the stack. Blending and shadowing reveal the volumes on this two-dimensional representation obtained with Imaris software. The nuclei of two LSEC are detected. A trophozoite is seen in the upper part of the image and in the centre an amoeba is partially covered by a LSEC, which has retracted from the substrate and the neighbouring cells. A membrane protrusion emitted by the trophozoite engulfs a portion of the LSEC (arrow and intersection of the white lines in Panel B). B. The micrograph shows three orthogonal planar sections. The white lines correspond to the orthogonal projection of the planes presented aside and their intersection represents the point indicated by the arrow in Panel A. The arrows indicate the orientation of the plane and z = 0 corresponds to the focal plane acquired closest to substratum. The retracted LSEC is detected with its nucleus. The trophozoite surface in contact with the LSEC is not homogeneously enriched in KERP1, as detected at the top of the trophozoite in the xz section. The three orthogonal sections show actin from LSEC (at the intersection of the white lines) surrounded by membrane protrusions from the parasite that are strongly enriched in KERP1. Note that, in the yz section, the membrane invagination is also detected and corresponds to the area with the highest z coordinates (i.e. the most distant from the z = 0) and the greatest KERP1 density. The three-dimensional reconstruction allowed detection of this topological link

