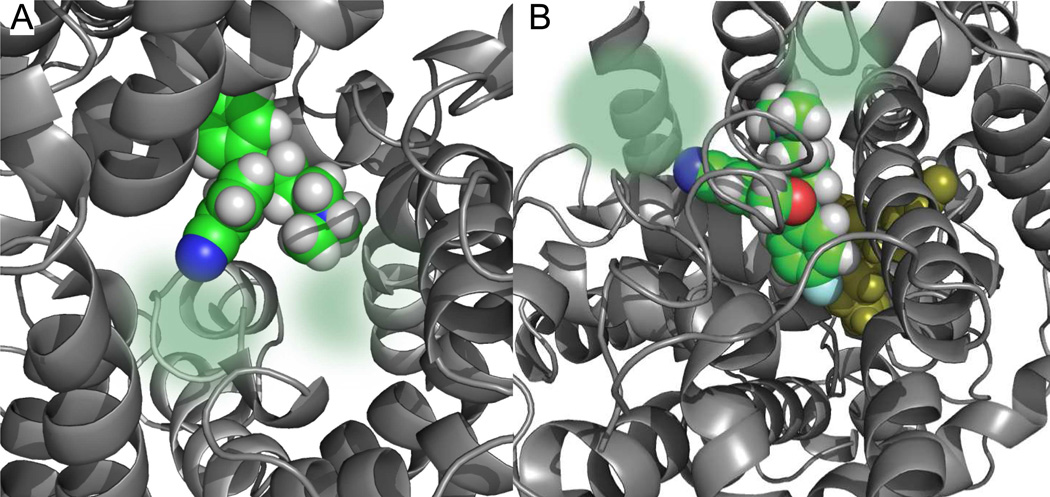
Figure 1.
Proposed binding mode of S-1 in the S1 and S2 sites of a SERT model. A. Top view showing a snap shot of the docking of S-1 into the central (S1) binding site of SERT. The binding site is mainly composed of transmembrane domains (TM) 1, 3, 6 and 8 (grey helices and loops) The residues within the top of TM1 and from the intracellular loops 1 and 3 have been removed for clarity. The S1-bound S-1 is depicted as a space filling model in green (carbons), grey (hydrogens) and blue (nitrogen). The areas in which the N- and 5-position substitutions on S-1 might bind are indicated by the transparent spheres in green. B. Docking of S-1 into the S2 site of SERT (top view). The binding site is mainly composed of TM1, 3, 8 and 10 as well as the extracellular loops 2 and 4. The S1 docked S-1 is located deeper into the SERT (yellow). In the S2 site docked S-1 also the oxygen (red) and the F-group (cyan) are depicted. As for the S1 docked S-1, the areas of interaction for the N- and 5-CN groups on S-1 are indicated by the transparent spheres in green. The docking models are taken from Ref. 27.

