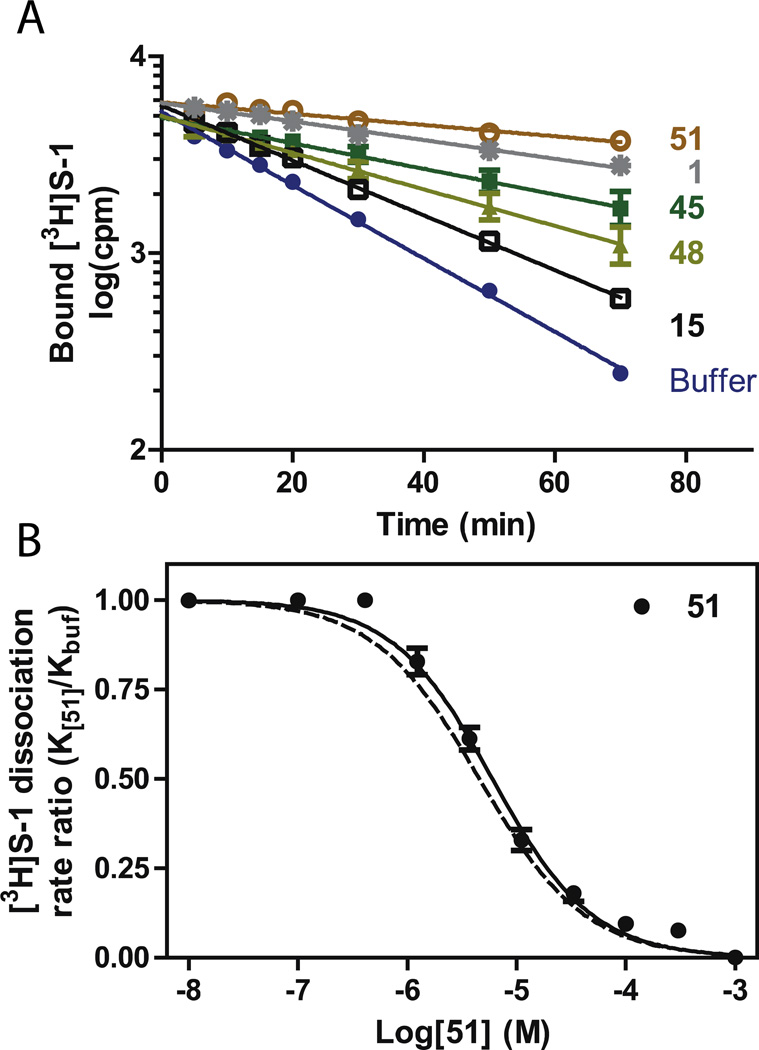
Figure 2.
Characterization of allosteric potency by selected analogues of 1. A. Experiments for the inhibition of prebound [3H]S-1 dissociation by 30 µM of selected analogues of 1 at 18 °C. The addition of the compounds affects [3H]S-1 dissociation to various extents relative to [3H]S-1 dissociation without the presence of compounds (filled circles). Data are shown relative to the dissociation without compound (filled circles) and the addition of 30 µM S-1 (gray stars). The t½ (in min) for the shown dissociation experiments are listed in Table 4, data are means±SE (error bars) of 3–6 experiments. B. Determination of allosteric potency for 51. Each data point represents a dissociation rate experiments as shown in A., at different concentrations of 51. The EC50 for 51 is 4.9[4.4;5.5] µM, mean[SE interval], N=8. The dotted line is the allosteric potency of S-1 as determined previously.27 All experiments are performed on membrane preparations from COS7 cells transiently expressing hSERT.

