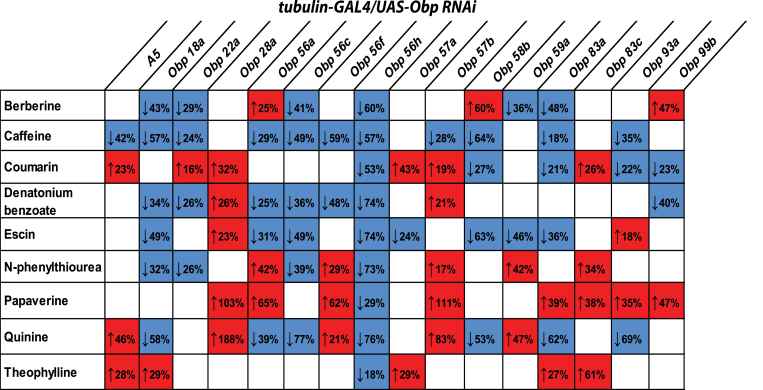
Figure 3.
Combinatorial response profiles for intake of bitter tastants of tubulin-GAL4/UAS-Obp RNAi lines. The red boxes and “up” arrow sign (↑) indicate more consumption of bitter tastant compared to the control, while the blue boxes and “down” arrow sign (↓) indicate less consumption of aversive tastant compared to the control. Numbers represent the magnitude of changes in consumption level as percentage compared to control. Note, that only female flies for the tubulin-GAL4/UAS-Obp58b RNAi line were available for testing.

