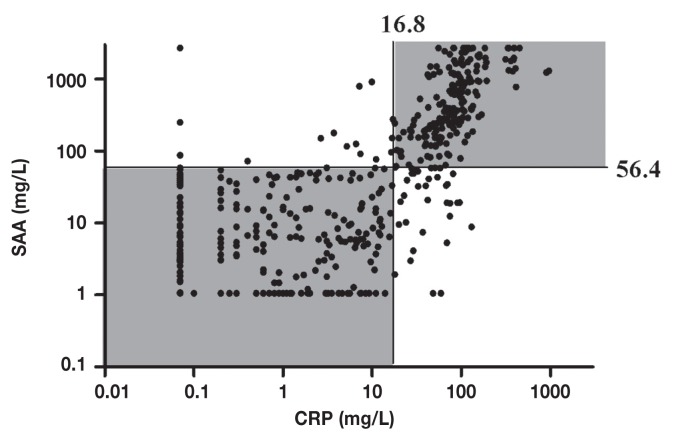
Figure 4.
Diagnostic measurements of serum amyloid A (SAA) and C-reactive protein (CRP) in 500 dogs plotted to illustrate the agreement in clinical classification. Measurements below detection limits were plotted as 1.06 mg/L for SAA and 0.07 mg/L for CRP, which were the previously calculated detections limits of the assays used in the study (9,28). Concentrations above the linear range of the SAA assay were assigned the value of the limit [2700 mg/L (38)]. Horizontal and vertical lines: clinical decision limits of canine SAA and CRP, respectively, as obtained by ROC analyses. Note that agreement in clinical classification was observed in 90% (450 out of 500) of the cases (shaded areas).

