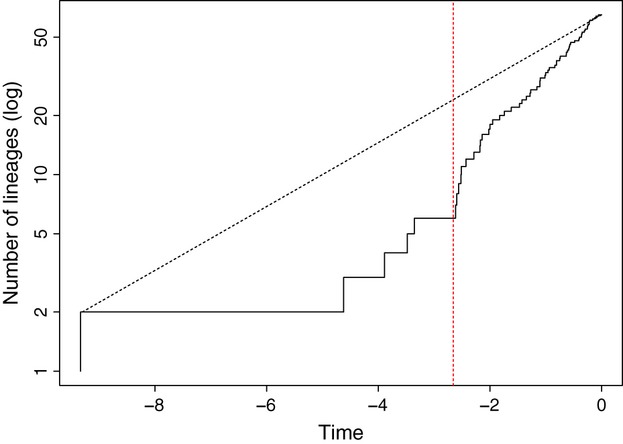
Figure 1.

Log-lineage-through-time plot (LTT plot, full line) describing the dynamics of cladogenesis within the genus Encephalartos over time. The black dashed line indicates the null expectation (pure-birth model); the red dashed line indicates the period of shift in diversification around 2.6 million years before present day.
