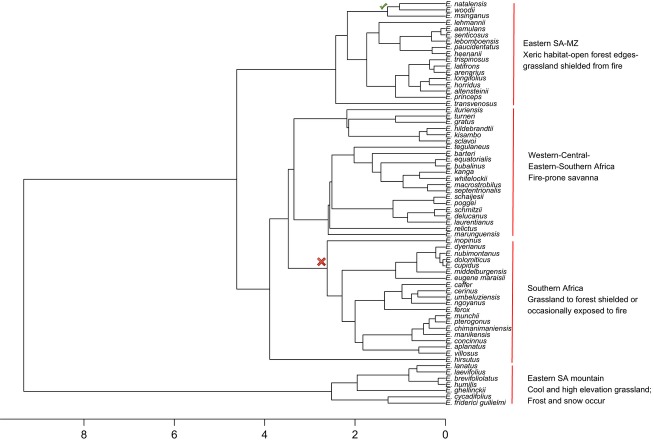
Figure 3.
Bayesian maximum clade credibility tree of Encephalartos inferred from the combination of all four DNA regions included in this study. Outgroups are not shown (but see Figure S1). The red cross indicates the node of the southern African clade with highest diversification rate. The geographical pattern of species along the phylogeny is indicated as well as habitat preferences. The green “tick” symbol indicates the node where nuclear and plastid genes were incongruent. Dates on the scale axis are in million years. SA = South Africa; MZ = Mozambique.

