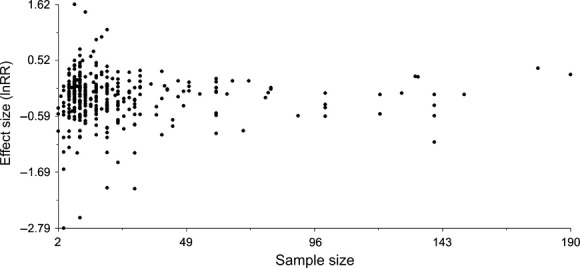
Figure 6.

Funnel Plot used to determine the potential for publication bias. The effect sizes plotted against the corresponding sample sizes for each response in the dataset to identify asymmetry in the distribution of responses. Funnel shape suggests low potential for publication bias.
