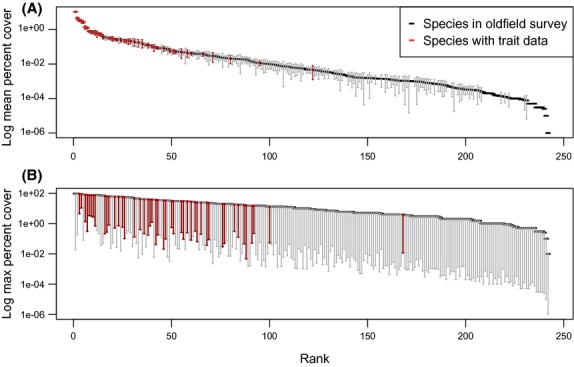
Figure 2.

Rank-abundance plots of the 248 plant species present in the Cedar Creek oldfield survey, using two of the four definitions of rarity: (A) mean abundance for each species; error bars are ±1 SE and (B) maximum abundance for each species; bars show the range down to the mean abundance value. Species for which we have trait data, and are thus included in our analyses, are highlighted in red. Species are ranked from the most common to the most rare.
