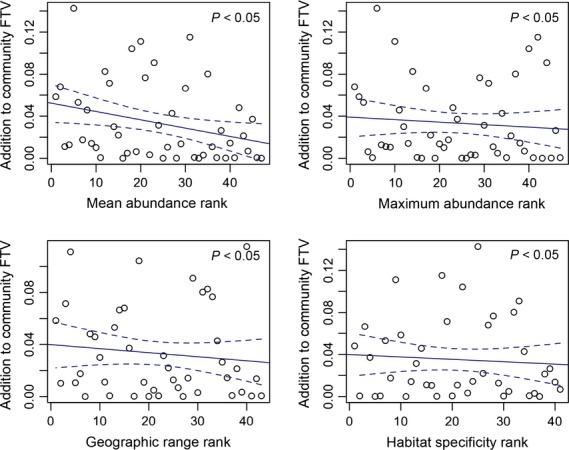
Figure 3.

Contribution of each species to community functional trait volume (FTV) based on the four measures of rarity used in this study. Community FTV is the FTV of the 46 species considered in our study. Each point represents the mean absolute contribution of each species to the total community FTV. Species are ranked from the most common to the most rare along the x-axis. A regression line and its 90% confidence intervals are plotted for each graph. Each of the four plots show a negative trend between rarity and contribution to FTV; however, this trend is only significant when rarity is defined as mean abundance (P < 0.05).
