
Figure 1.
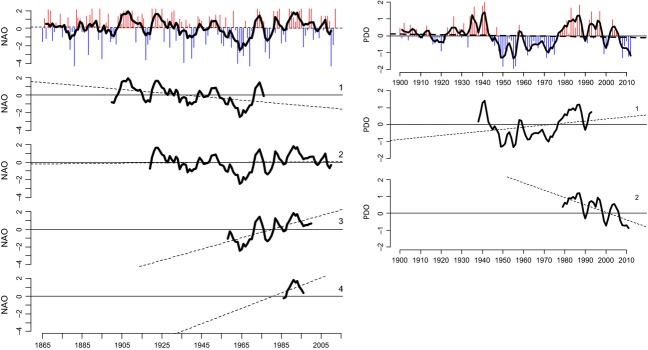
a Left: The North Atlantic Oscillation (NAO) station-based seasonal index for winter (includes December – February) since 1865 (Hurrell 1995): annual index (vertical lines) are shown in the top panel, and 5 year running mean (black line) is shown in all panels. The portion of the NAO time series in each lower panel show the years included in a selection of studies in Table 1: (i) Sundby and Nakken (2008); (ii) Rogers et al. (2011); (iii) Beaugrand et al. (2003); (iv) Kjesbu et al. (1998). Dotted lines are linear regression lines fit to the period of data shown. Right: The PDO index since 1900: annual index (vertical lines) are shown in the top panel, and 3 year running mean (black line) is shown in all panels. The portion of the PDO time series in each lower panel show the years included in selected studies from Table 1: (i) Quinn and Adams (1996); (ii) Kovach et al. (2012). Dotted lines are linear regression lines fit to the period of data shown. Note that local temperatures do not necessarily follow the PDO, but may have additional trend upon them, as in the Kovach study.