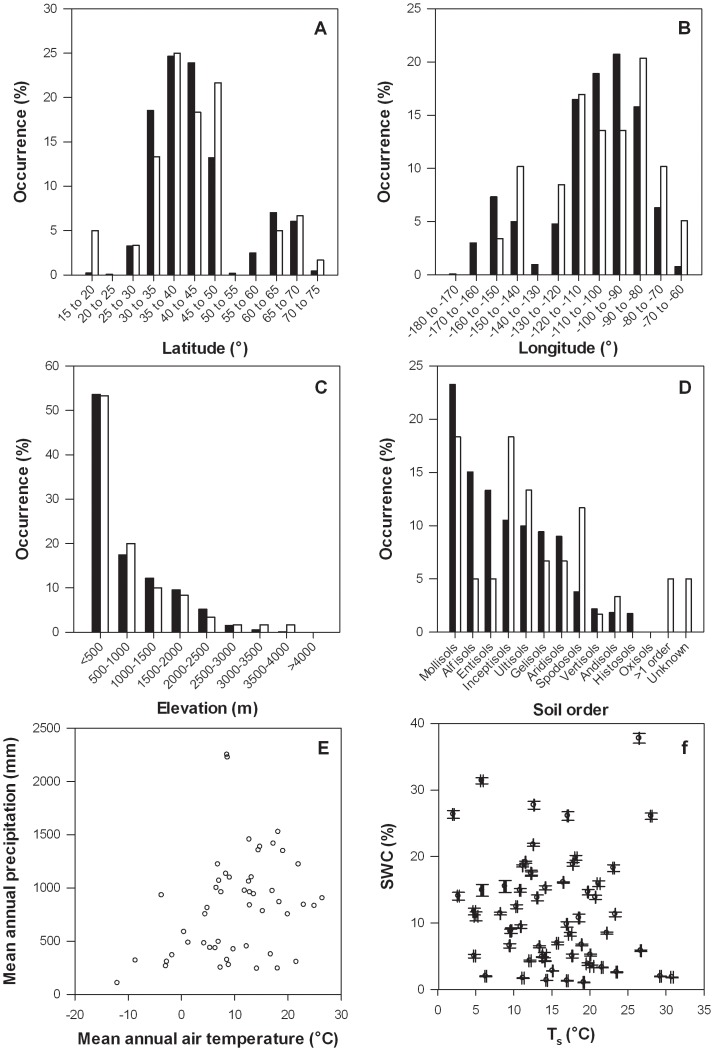
Figure 2. The sites were broadly representative of the US.
Percent occurrence of land in latitudinal (a), longitudinal (b), elevational (c), and soil order (d) categories in the US (black bars), and our study sites (white bars). The study sites also occupied a wide range of climates (e) and Ts and SWC conditions at the time of samplings (f). Error bars in (f) represent ±1 SE.

