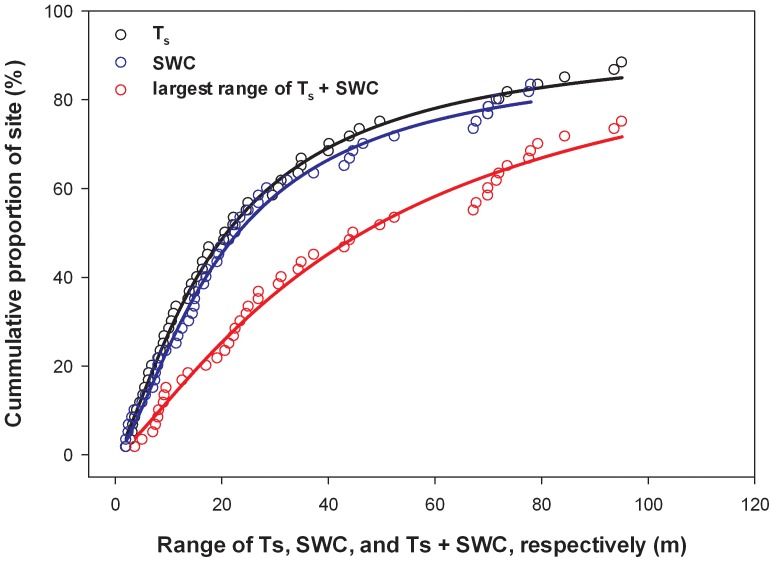
Figure 6. Semivariogram range for Ts, SWC, and the largest range for Ts or SWC at each site versus the cumulative proportion of sites.
A logistic curve was fitted to the data with R2 of 1.00, 0.99, and 0.99 for Ts, SWC, and Ts and SWC, respectively. Equations for the curves can be found in the results section (Eq. 6a–c).

