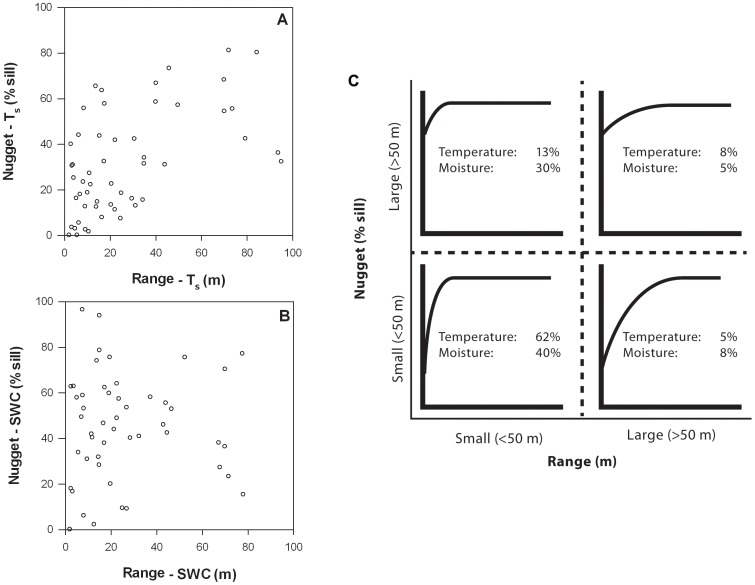
Figure 9. Semivariogram range versus nugget for Ts (a) and SWC (b), and the relative occurrence of semivariograms with small (>50 m) or large (>50 m) range values and small (<50% sill) or large (>50% sill) nugget values.
The percentages in (c) are based on all 60 sites, including the sites where range values exceeded the maximum distance of the semivariogram model (i.e., 7 sites (12%) for Ts and 10 sites (17%) for SWC). As a result, the percentages do not add up to 100%. Since the semivariograms that did not reach an asymptote all had range values that exceeded 50 m, the percentages in the right two quadrants are underestimated by a total of 12 and 17 percentage points for Ts and SWC, respectively.

