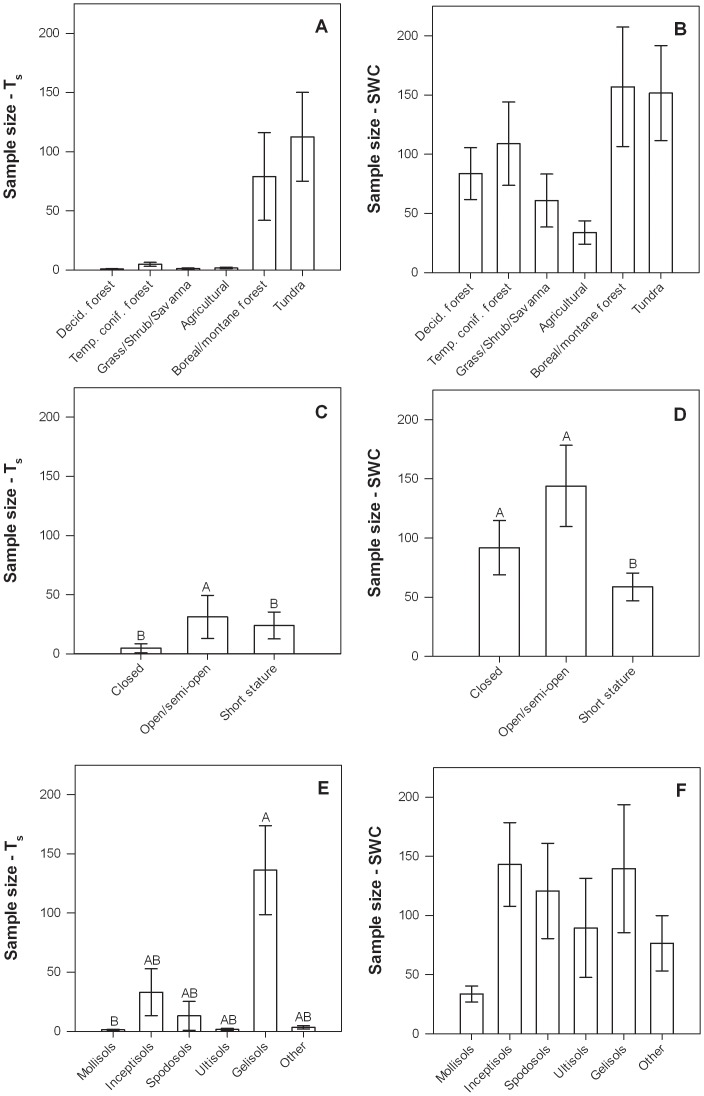
Figure 12. Number of samples to measure Ts (left column) and SWC (right column) to within 10% of the spatial mean with 90% confidence at each site in relation to ecosystem type (a, b), canopy structure (c, d), and soil type (e, f).
Error bars represent ±1 SE. Bars with different letter were significantly different (p<0.05) based on Tukey HSD tests. The letter “A” corresponds to the largest least square mean(s) and subsequent letters (B, C, …) correspond to progressively smaller least square means.

