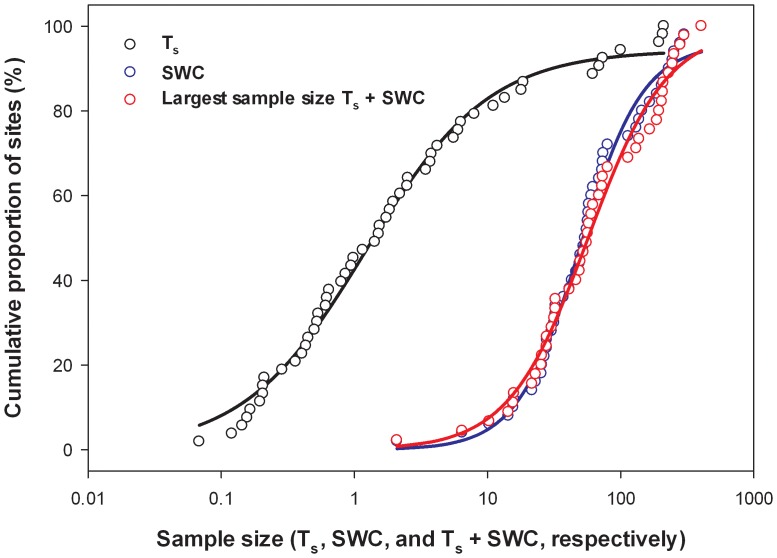
Figure 13. Number of samples required to measure Ts, SWC, or Ts and SWC to within 10% of the spatial mean with 90% confidence versus the cumulative proportion of sites.
A logistic curve was fitted to the data with R2 = 0.99 for each equation (Eqs. 7a–c). Values are plotted in a semi-log scale due to large differences in magnitude across the sites.

