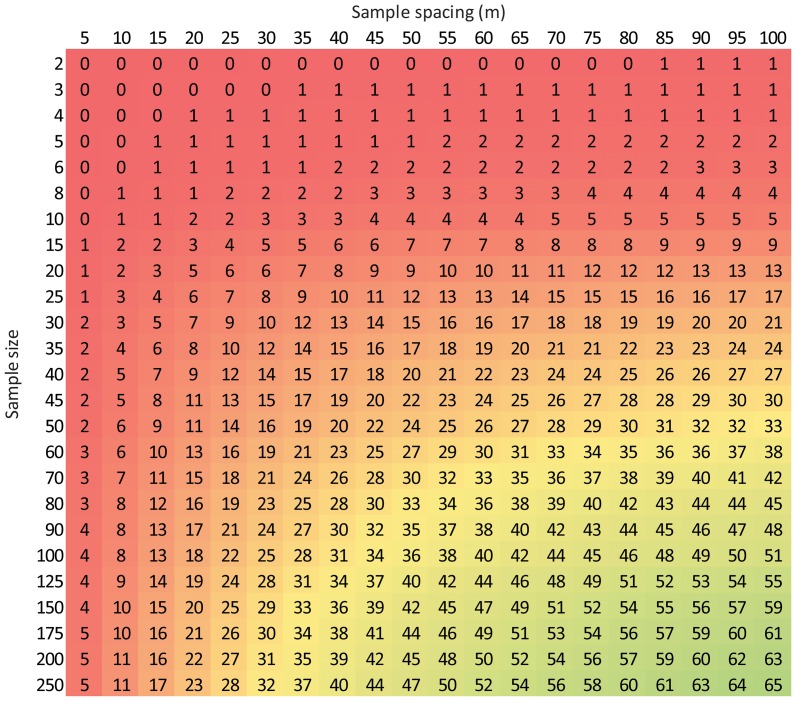
Figure 16. Efficacy of different sampling strategies at measuring Ts and SWC to within 10% of the spatial mean with 90% confidence at scales of ∼1 ha.
Values represent the percent of sites where the corresponding sampling strategy would achieve the accuracy requirement. The x-axis is based on Equation 6c and the y-axis is based on Equation 7c. Legend in Figure 14.

