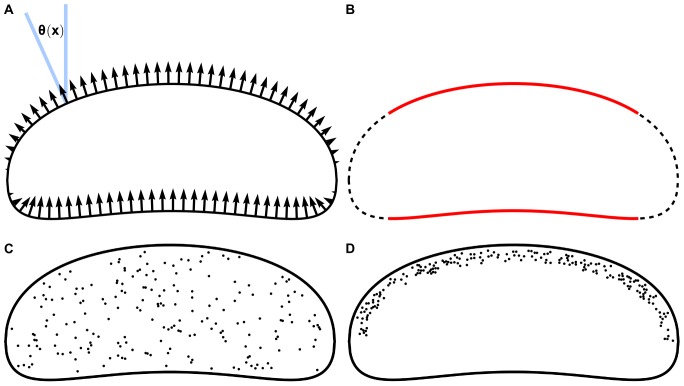
Figure 2. Lamellipodial shape and protein and velocity distributions.
Shape of cell's lamellipodium given by equations (4–5). A: Sketch of velocity boundary condition (equation (6)) given by the graded radial extension model. Velocity at the boundary is normal to the boundary, and decreases in magnitude from a maximum when the normal points in the direction of cell motion to zero when the boundary is tangent to the direction of motion. B: Membrane boundary with leading and rear edges in red. We integrate tension over these red curves to compute the average tension at the front and rear of the cell, which allows us to compute the tension drop in the membrane. C–D: Randomly generated placements of transmembrane proteins distributed uniformly throughout the membrane (C) and distributed within 1 µm of the cell front (D).

