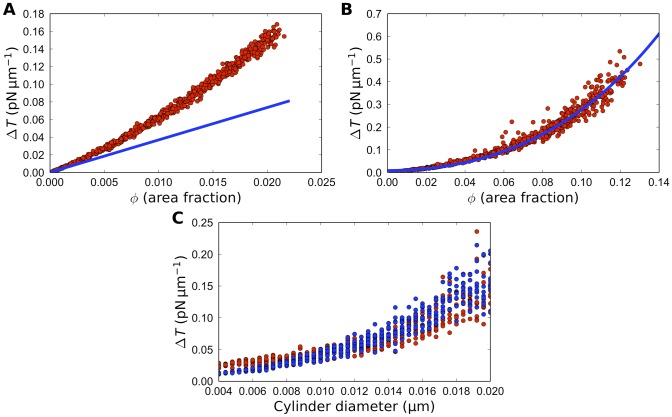
Figure 4. Computed membrane tension gradient.
A: Computed average membrane tension drop as a function of the area fraction of proteins for uniform distributions of proteins (red) compared with the analytic linear prediction (blue). B: Computed average membrane tension drop as a function of the area fraction of proteins for front-loaded proteins (red) compared with the analytic linear prediction from equation (16) (blue). The data in (A–B) are for variable number of proteins 0.1 µm in diameter. C: Numerical results (red) and equation (16) fit (blue) for tension drop as a function of protein diameter. The data points include front loaded simulations and show individual simulation results from the runs with varied diameters and protein number equal to 100. Other parameters are listed in Table 1.

