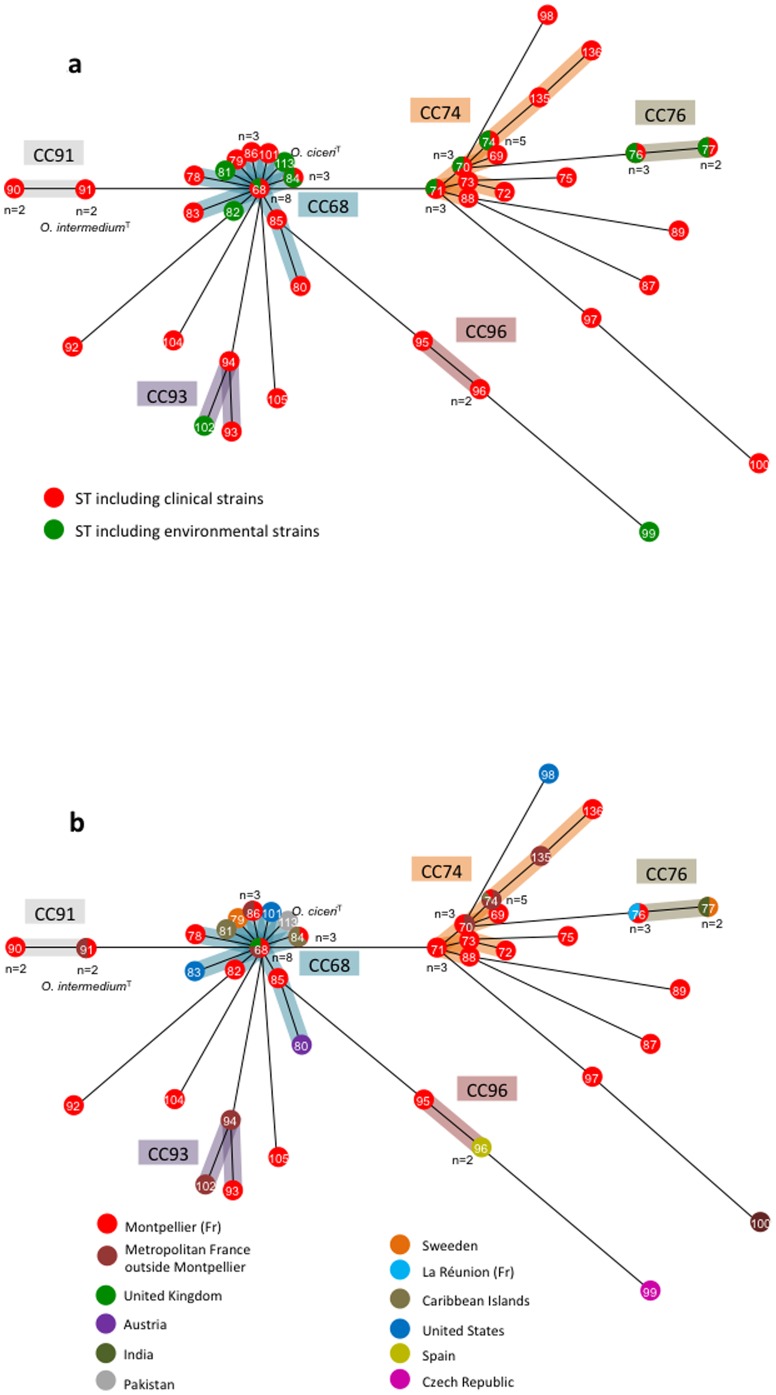
Figure 2. Minimum-Spanning (MS) tree for 64 strains of O. intermedium and type strain of O. ciceri based on MLST data.
The tree was based on the allelic profiles. Each circle corresponds to a sequence type (ST). The number given in the circle corresponds to the ST designation. The number given near the circle corresponds to the number of isolates forming the ST. Shading areas indicate the clonal complexes (CC68, CC74, CC76, CC91, CC93 and CC96). (A) MS tree depending on the clinical (red circles) or environmental origin (green circles) of the strains. (B) MS tree depending on the geographical origin of the strains.

