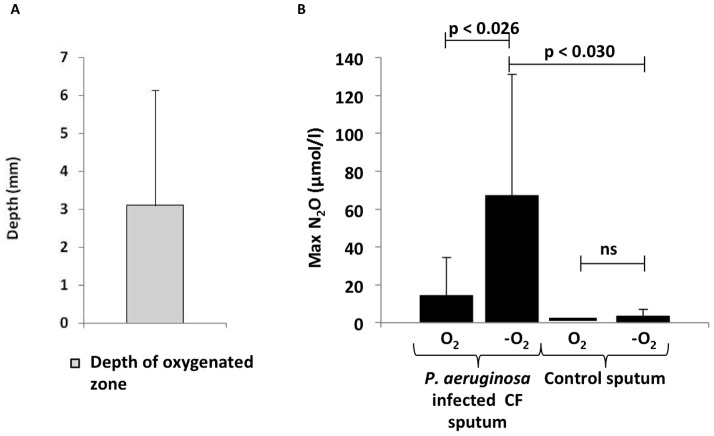
Figure 3. Distribution of O2 and N2O in sputum.
(A) Depth of oxygenated zone in sputum samples from cystic fibrosis patients with chronic P. eruginosa lung infection (n = 8). (B) Maximal N2O concentration in the oxic zone and anoxic zone in sputum samples from cystic fibrosis patients with chronic P. aeruginosa lung infection (n = 8). Control sputum without detectable P. aeruginosa was obtained from two PCD patients and one CF patient. Statistical analysis was performed by Student t-test.

