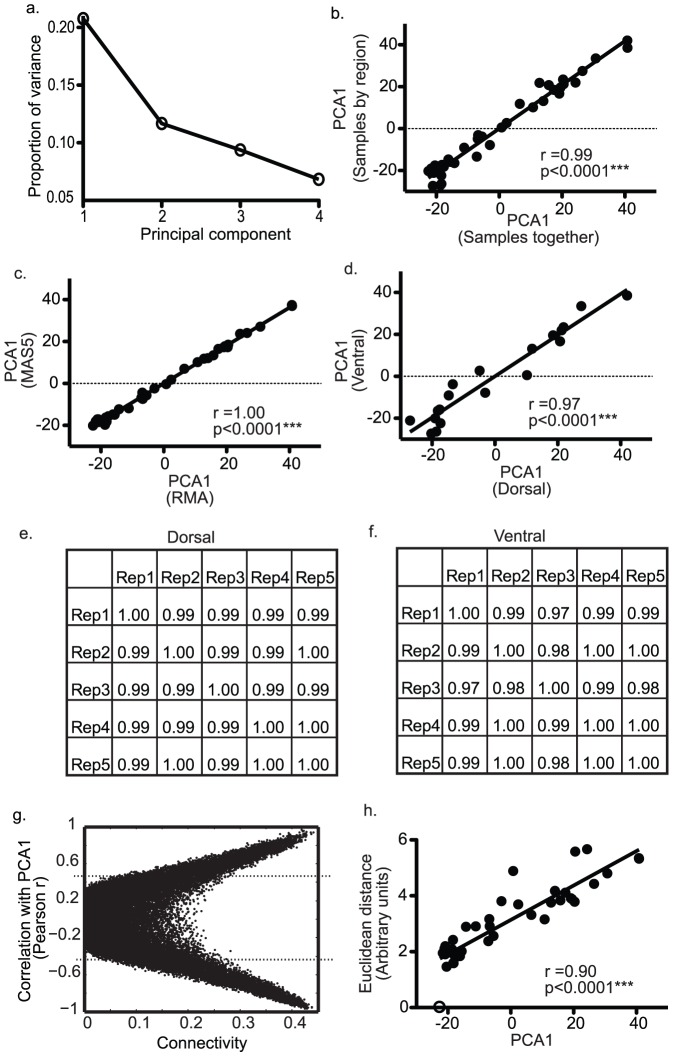
Figure 1. Principal components analysis generates a robust meaure (PCA1) of gene expression system state.
Panel (a) plots the proportion of variance explained by principal components 1–4. Panel (b) is a bivariate plot of PCA1 values obtained from PCA done on all samples grouped together (x-axis) versus PCA1 from separate PCAs on samples grouped by region (y-axis) (r = 0.99, p<0.001). Panel (c) shows that the data processing algorithm used has no effect on values for PCA1 (r = 1.00, p<0.001). Panel (d) compares PCA1 values of dorsal and ventral dentate from the same mice (r = 0.97, p<0.001). Panels (e–f) are cross-correlation tables for PCA1 values obtained from PCA on independent groups of 2000 expression levels/group in dorsal (e) and ventral (f) dentate samples. Panel (g) plots gene connectivity (x-axis) against the correlation coefficient of genes with PCA1 demonstrating that more connected genes follow more closely with PCA1. Panel (h) plots PCA1 versus the Euclidean distance of transcriptomes from the transcriptome with the lowest value for PCA1 (open circle).

