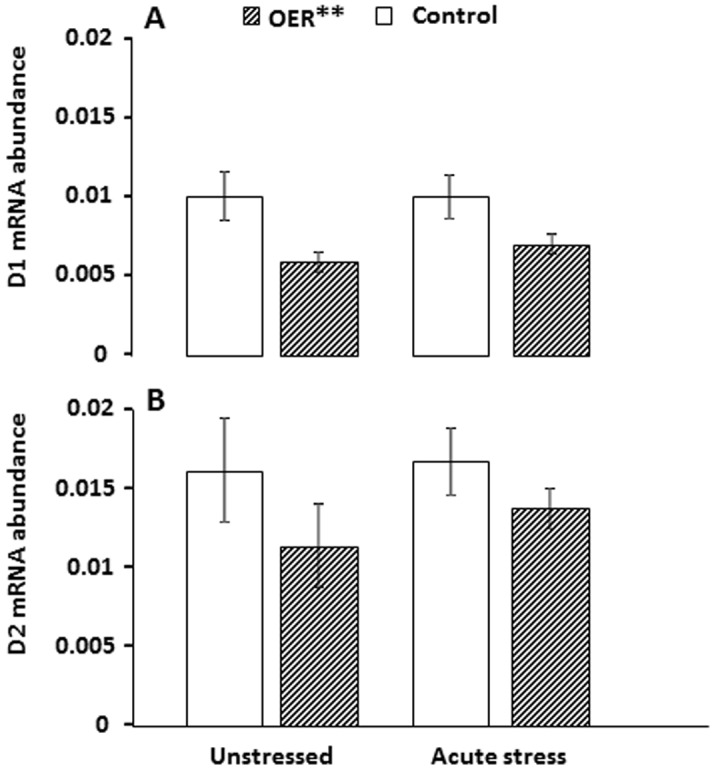
Figure 4. Mean (± SEM) D1 (A) and D2 (B) receptor mRNA abundance (mRNA receptor abundance normalized to EF1α mRNA abundance) in telencephalon of omission of expected reward (OER) treated and control groups under unstressed and stressed conditions.

A: ANOVA statistics F 3 = 3.14, p = 0.03 followed by a Tukey HSD post-hoc test. An additional one-way ANOVA was conducted to elucidate overall effects of OER treatment, F (3) = 8.95, p = 0.004 (Note that OER** refers only to D1).B: Kruskall-Wallis test, p = 0.27.
