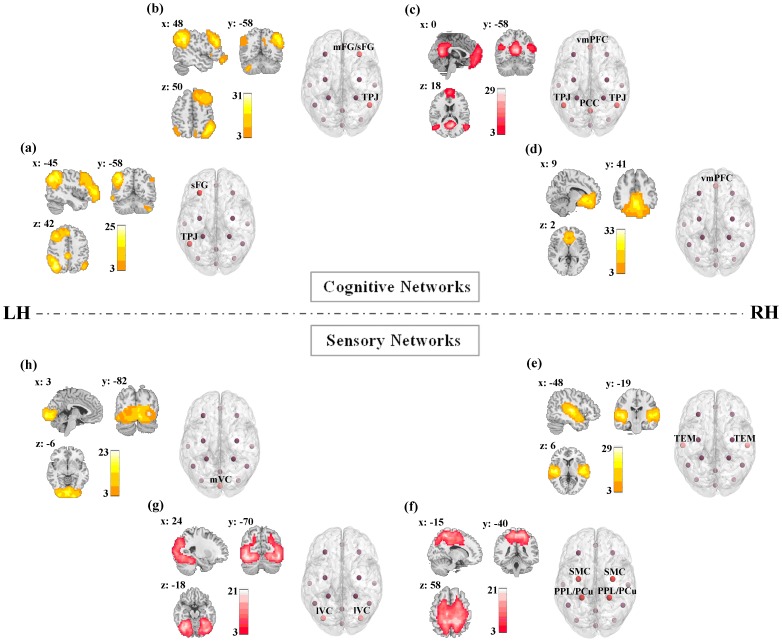
Figure 1. Coronal, sagittal, and axial views of the spatial maps and the corresponding spatial patterns of the cognitive and sensory networks in resting state.
a–h represent the RSNs, including VAN, DAN, DMN, SRN, AN, SMN, LVN and MVN, for the experiment group respectively. Red nodes in each spatial pattern represented the regions significantly recruited in the RSN. The red spatial map indicated that the corresponding RSN has exhibited significant alterations of the resting-state functional connectivity after learning. Each map was the result of one-sample t-tests on the individual patterns that were identified using the combined data of pre- and post-rest scans, p<0.005, FDR corrected.

