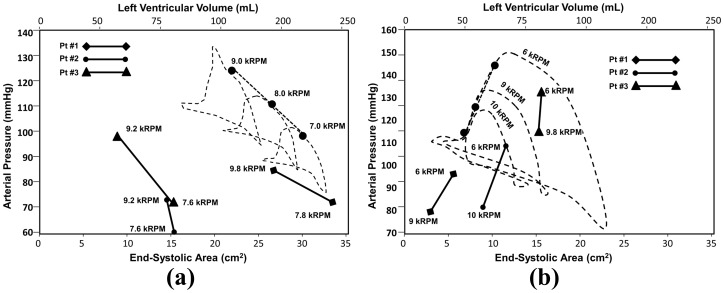
Figure 10. Comparison of clinical recording of end systolic arterial pressure (AP) vs. LV area (LVA) recorded by echocardiography and finger plethysmography (solid lines) with corresponding simulation (dashed lines.).
(a) Patients who were deemed VAD dependent exhibit decrease of AP with decreased VAD support (increased preload); (b) whereas patients who were successfully weaned from LVAD support exhibited a physiological preload response: increasing AP with increased preload. The simulations (in which LVV was substituted for LVA) exhibited similar behavior.

