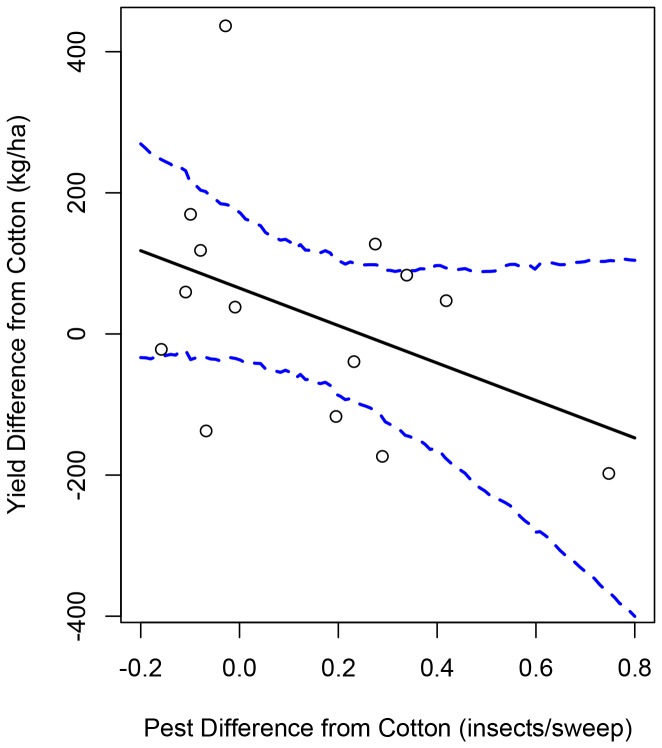
Figure 2. For each of the 14 crops other than cotton, we calculated the posterior mean of the mean difference in yield when that crop was grown in the field the year before compared to when cotton was grown in the field the year before (y-axis; these estimates are also displayed in Figure 1A).
We also calculated the posterior mean of the difference in mean June L. hesperus densities between fields where a specific crop was grown the year before and where cotton was grown the year before (x-axis; these estimates are also displayed in Figure 1B). These estimates are plotted above (open circles). Then, we fit a linear model by regressing the mean yield differences on the mean L. hesperus differences. The posterior mean of the model fit (solid black) and 95% HPDI (dashed blue) are overlaid.

