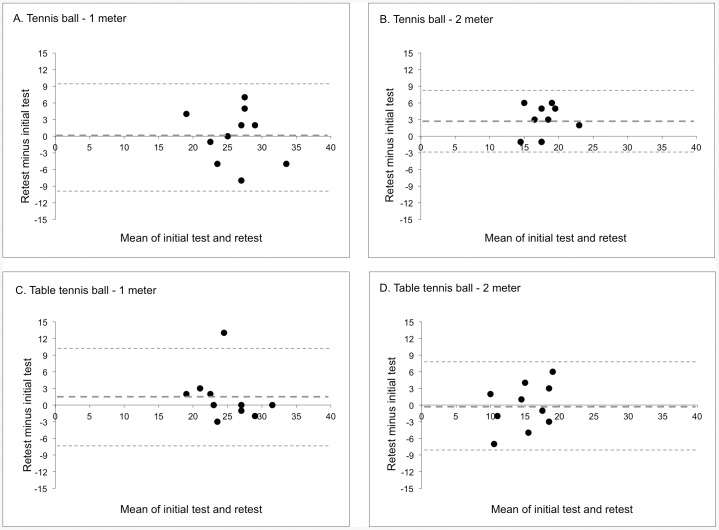
Figure 3. Bland-Altman plots for ‘between session’ reproducibility; A. Tennis ball - 1 meter, B. Tennis ball – 2 meter, C. Table tennis ball – 1 meter, D. Table tennis ball – 2 meter.
The bold dotted line represents the mean difference (number of correctly caught balls/30 seconds) between the initial test and retest. The non-bold dotted lines represent the 95% limits of agreement (±1.96•SD).

