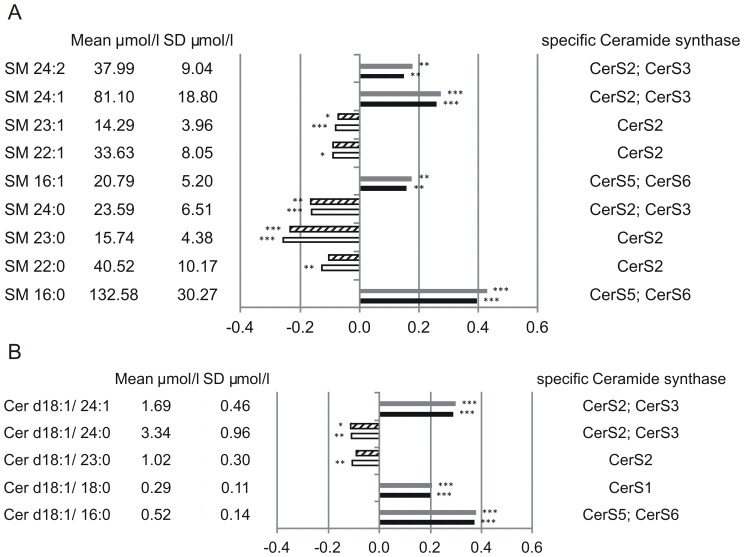
Figure 3. Mortality association of SM species (A) and Cer species (B).
EDTA plasma concentrations were determined by ESI-MS/MS. Species with significant association to CAD and total mortality are shown. Models were adjusted for age, gender, smoking, LDL, HDL, diabetes and hypertension. Bars represent the hazard ratio −1. Positive association with CAD is shown in grey and positive association with total mortality in black. Negative association with CAD is shown by a dashed white bar and negative association with total mortality in white. Species are named according to the number of carbon atoms and degree of desaturation. Besides their association the mean concentration and standard deviation are shown together with the putative involved Cer-synthase. SM species annotation is based on the assumption that d18∶1 (dihydroxy 18∶1 sphingosine) is the main base of plasma SM species.

