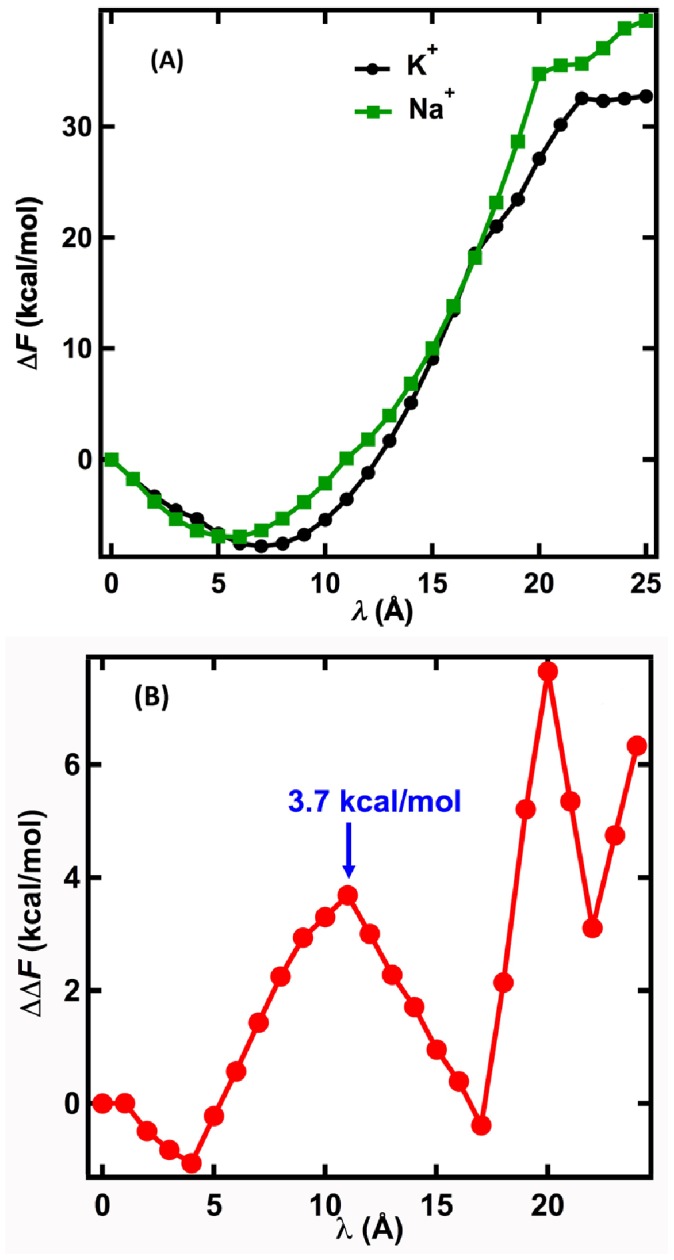
Figure 2. Free energy profiles for Na+ and K+ ions in the KcsA channel.

(A) Free energy difference (ΔF) for Na+ and K+ ions after each pulling step (λ) compared to λ = 0. (B) Magnitude of the difference between Na+ and K+ ion free energy differences (ΔΔF) at each position of λ shown in (A). (C) The convergence of ΔΔF at λ = 11 Å during relaxation time τ. The uncertainty for computing free-energy profiles is about 1 kcal/mol.
