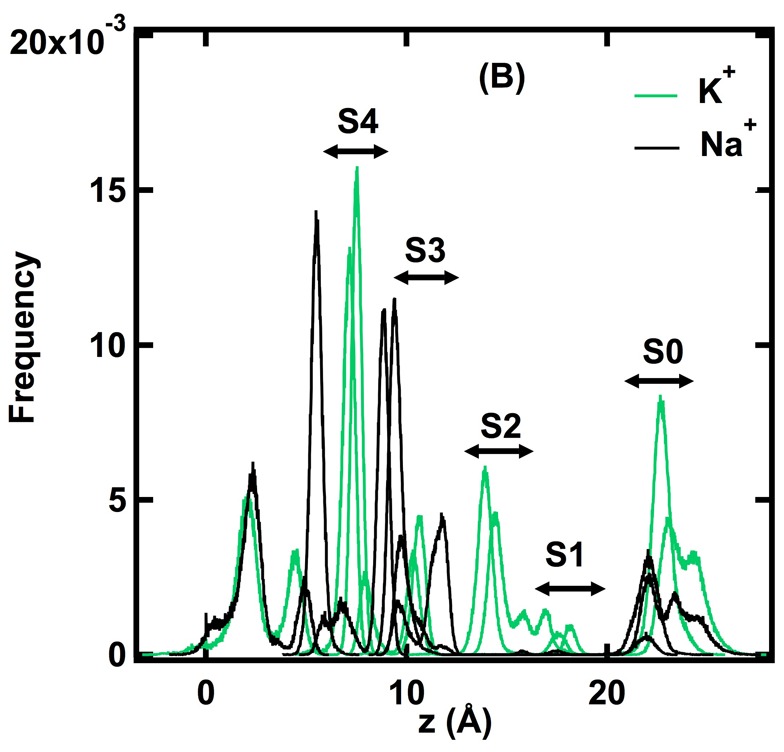
Figure 3. Histogram showing the frequency (probability) of finding the Na+ and K+ ions at each position (z) in the selectivity filter during step-wise pulling.

The histogram is constructed from 25 pulling-step simulations for each ion. During relaxation of each pulling step, the positions of the pulled ions were collected every 100 fs and were put into bins of 0.01 Å width along the z-axis. Sites S0–S4 correspond to sites of stable K+ binding in the selectivity filter of KcsA. Stable Na+ positions are located in the plane of the carbonyl oxygen atoms that separate stable K+ binding sites. Note that Na+ ions are not stable within the selectivity filter at positions beyond the S2–S3 junction until they emerge from the channel at S0. Z = 0 corresponds to the center of mass of the protein-lipid-water system, within the central water-filled cavity in the transmembrane domain of the channel.
