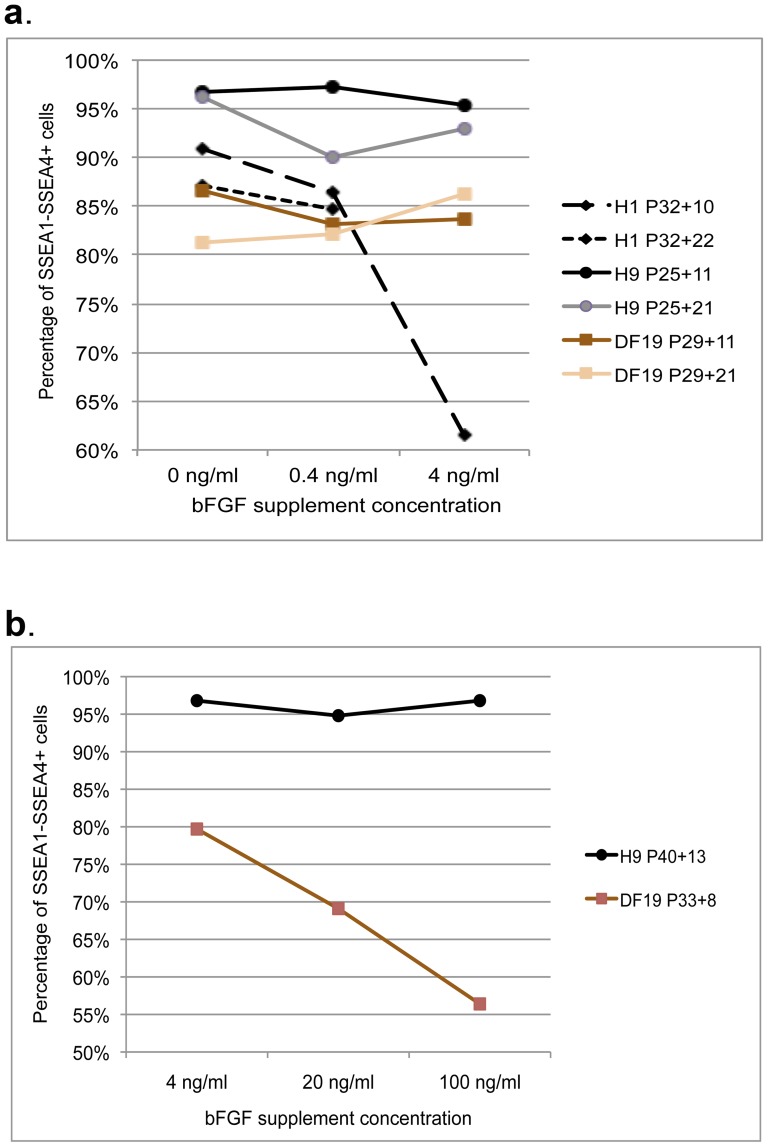
Figure 13. Flow cytometry analysis of SSEA1 and SSEA4 expression in all cell cultures.
A. H1, H9 and DF19 cells were analyzed after both 10/11 and 21/22 passages of culture on Ad-hMSCs feeder cells in 0, 0.4 or 4 ng/ml bFGF media. B. H9 and DF19 cells were analyzed after 13 and 8 passages of culture respectively on Ad-hMSCs feeder cells in 4, 20 or 100 ng/ml bFGF media. See also Figure S3.

