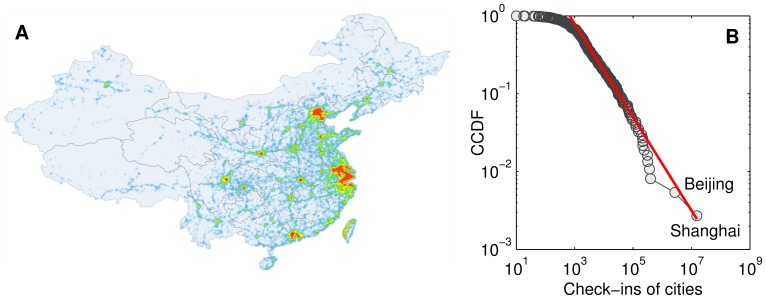
Figure 1. Heat map of all check-in points and frequency distribution of check-ins in the 370 cities.
(A) The map, created using density estimation, clearly depicts the distributions of cities and transportation networks in China. Note that The South China Sea Islands are not shown for simplicity. (B) As shown by the CCDF (complementary cumulative distribution function), the frequency distribution exhibits a heavy tail characteristic. Shanghai and Beijing, the two biggest cities in China, have the most check-in records.

